54 Hatch Ave Saint Paul, MN 55117
North End NeighborhoodEstimated Value: $209,000 - $224,000
3
Beds
2
Baths
1,352
Sq Ft
$162/Sq Ft
Est. Value
About This Home
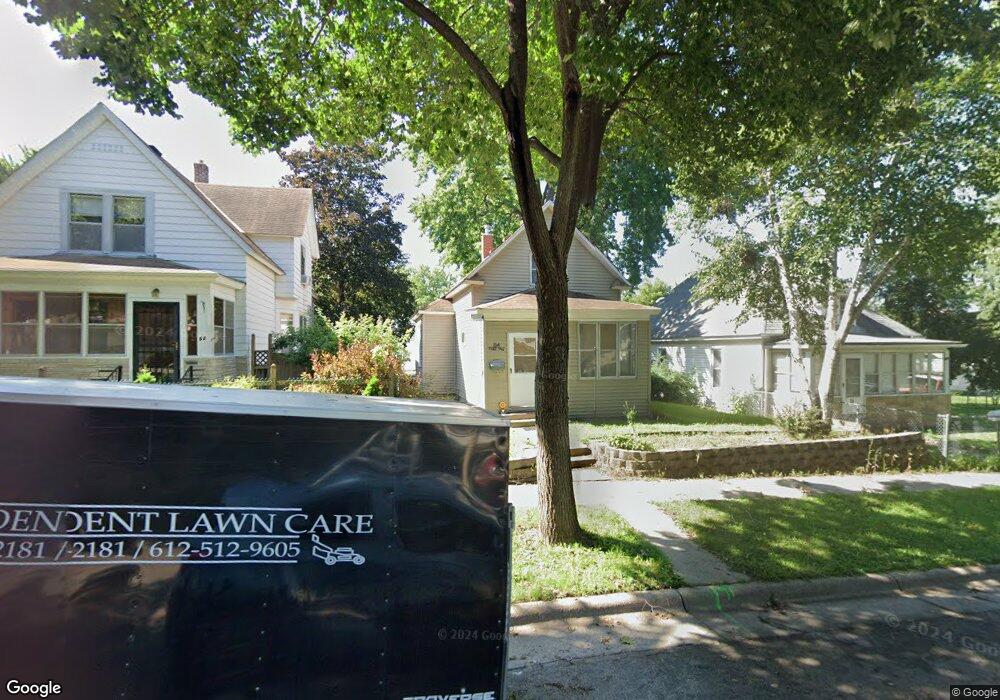
This home is located at 54 Hatch Ave, Saint Paul, MN 55117 and is currently estimated at $219,190, approximately $162 per square foot. 54 Hatch Ave is a home located in Ramsey County with nearby schools including Bruce F Vento Elementary School, Washington Technology Magnet School, and Community School of Excellence.
Ownership History
Date
Name
Owned For
Owner Type
Purchase Details
Closed on
Mar 25, 2022
Sold by
Melvin Carter Iii and Melvin Sakeena A
Bought by
Gordon Natasha and Gordon Latroy
Current Estimated Value
Home Financials for this Owner
Home Financials are based on the most recent Mortgage that was taken out on this home.
Original Mortgage
$196,377
Outstanding Balance
$183,807
Interest Rate
3.92%
Mortgage Type
New Conventional
Estimated Equity
$35,383
Purchase Details
Closed on
Sep 25, 2000
Sold by
Keeley Terrence Robert and Keeley Keith E
Bought by
Hansel John R
Create a Home Valuation Report for This Property
The Home Valuation Report is an in-depth analysis detailing your home's value as well as a comparison with similar homes in the area
Home Values in the Area
Average Home Value in this Area
Purchase History
| Date | Buyer | Sale Price | Title Company |
|---|---|---|---|
| Gordon Natasha | $200,000 | Gibraltar Title | |
| Hansel John R | $78,500 | -- |
Source: Public Records
Mortgage History
| Date | Status | Borrower | Loan Amount |
|---|---|---|---|
| Open | Gordon Natasha | $196,377 | |
| Closed | Gordon Natasha | $196,377 |
Source: Public Records
Tax History
| Year | Tax Paid | Tax Assessment Tax Assessment Total Assessment is a certain percentage of the fair market value that is determined by local assessors to be the total taxable value of land and additions on the property. | Land | Improvement |
|---|---|---|---|---|
| 2025 | $2,912 | $226,400 | $25,000 | $201,400 |
| 2024 | $2,912 | $215,500 | $25,000 | $190,500 |
| 2023 | $2,912 | $192,200 | $20,000 | $172,200 |
| 2022 | $5,290 | $183,700 | $20,000 | $163,700 |
| 2021 | $4,930 | $150,400 | $20,000 | $130,400 |
| 2020 | $2,506 | $144,100 | $10,400 | $133,700 |
| 2019 | $2,746 | $136,800 | $10,400 | $126,400 |
| 2018 | $2,194 | $129,700 | $10,400 | $119,300 |
| 2017 | $2,050 | $114,300 | $10,400 | $103,900 |
| 2016 | $1,706 | $0 | $0 | $0 |
| 2015 | $1,578 | $83,400 | $10,400 | $73,000 |
| 2014 | $1,534 | $0 | $0 | $0 |
Source: Public Records
Map
Nearby Homes
- 101 Manitoba Ave
- 89 Winnipeg Ave
- 940 Albemarle St
- 27 Magnolia Ave E
- 36 Winnipeg Ave
- 48 Jessamine Ave E
- 71 Magnolia Ave E
- 120 E Case
- 821 Hardenbergh Place
- 1098 Woodbridge St
- 809 Park St
- 1136 Albemarle St
- 925 Marion St
- 954 Galtier St
- 903 Marion St
- 137 Cayuga St
- 101 Granite St
- 137 Jessamine Ave E
- 23 Acker St W
- 283 Front Ave