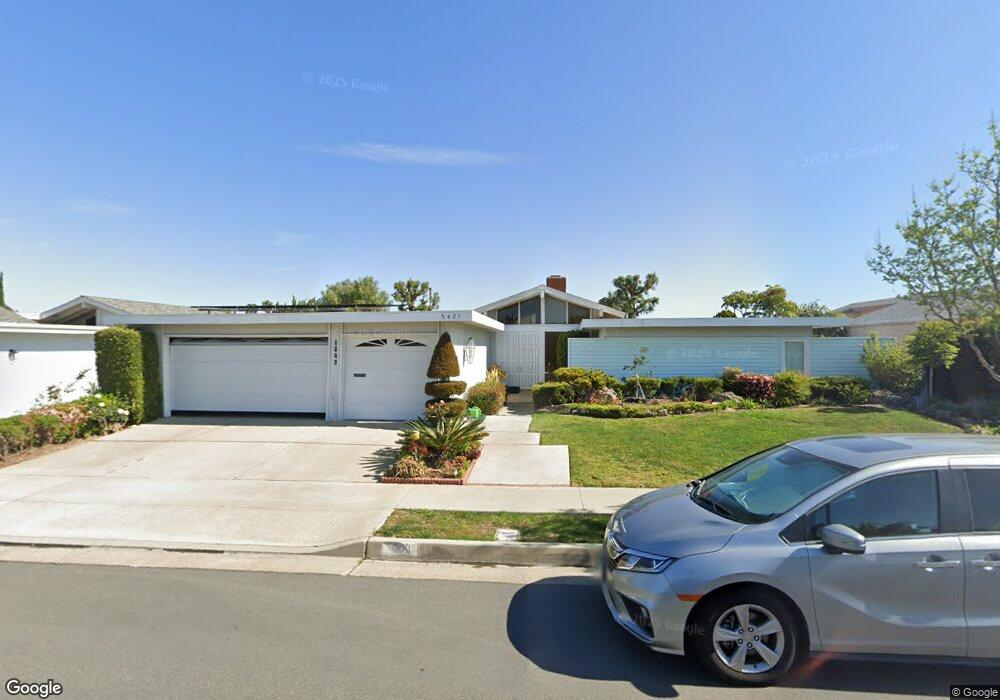
5421 Catowba Ln Unit 505 Irvine, CA 92603
Turtle Rock NeighborhoodEstimated Value: $922,000 - $1,251,000
1
Bed
1
Bath
1,349
Sq Ft
$756/Sq Ft
Est. Value
About This Home
This home is located at 5421 Catowba Ln Unit 505, Irvine, CA 92603 and is currently estimated at $1,019,747, approximately $755 per square foot. 5421 Catowba Ln Unit 505 is a home located in Orange County with nearby schools including Turtle Rock Elementary, Rancho San Joaquin Middle School, and University High School.
Ownership History
Date
Name
Owned For
Owner Type
Purchase Details
Closed on
Dec 16, 2020
Sold by
Levy Howard and Levy Patricia
Bought by
Lee Sung Bin and Park Karp Young
Current Estimated Value
Purchase Details
Closed on
Sep 16, 2017
Sold by
Kim Michael Tacewoo
Bought by
Huang Kathy J
Purchase Details
Closed on
Aug 30, 2017
Sold by
Huang Mike S and Huang Ivy L
Bought by
Levy Howard and Levy Patricia
Purchase Details
Closed on
Mar 25, 2010
Sold by
Huang Mike S and Huang Ivy L
Bought by
Huang Mike S and Huang Ivy L
Purchase Details
Closed on
May 1, 2007
Sold by
The Plaza Irvine Llc
Bought by
Huang Mike S and Huang Ivy L
Home Financials for this Owner
Home Financials are based on the most recent Mortgage that was taken out on this home.
Original Mortgage
$510,000
Interest Rate
6.12%
Mortgage Type
Purchase Money Mortgage
Create a Home Valuation Report for This Property
The Home Valuation Report is an in-depth analysis detailing your home's value as well as a comparison with similar homes in the area
Home Values in the Area
Average Home Value in this Area
Purchase History
| Date | Buyer | Sale Price | Title Company |
|---|---|---|---|
| Lee Sung Bin | $675,000 | California Title Company | |
| Huang Kathy J | -- | California Title Co | |
| Levy Howard | $343,273 | Californiya Title Co | |
| Huang Mike S | -- | Accommodation | |
| Huang Mike S | $649,500 | First American Title Co |
Source: Public Records
Mortgage History
| Date | Status | Borrower | Loan Amount |
|---|---|---|---|
| Previous Owner | Huang Mike S | $510,000 |
Source: Public Records
Tax History Compared to Growth
Tax History
| Year | Tax Paid | Tax Assessment Tax Assessment Total Assessment is a certain percentage of the fair market value that is determined by local assessors to be the total taxable value of land and additions on the property. | Land | Improvement |
|---|---|---|---|---|
| 2025 | $8,045 | $730,641 | $302,929 | $427,712 |
| 2024 | $8,045 | $716,315 | $296,989 | $419,326 |
| 2023 | $7,852 | $702,270 | $291,166 | $411,104 |
| 2022 | $7,782 | $688,500 | $285,456 | $403,044 |
| 2021 | $7,285 | $647,407 | $301,493 | $345,914 |
| 2020 | $7,306 | $640,769 | $298,401 | $342,368 |
| 2019 | $7,153 | $628,205 | $292,550 | $335,655 |
| 2018 | $6,862 | $615,888 | $286,814 | $329,074 |
| 2017 | $7,503 | $673,200 | $336,600 | $336,600 |
| 2016 | $7,350 | $660,000 | $330,000 | $330,000 |
| 2015 | $7,329 | $686,000 | $356,000 | $330,000 |
| 2014 | $6,225 | $560,000 | $230,000 | $330,000 |
Source: Public Records
Map
Nearby Homes
- 19165 Beckwith Terrace
- 19112 Biddle Dr
- 5821 Sierra Cielo Rd
- 18816 Saginaw Dr
- 19281 Sierra Inez Rd
- 21 Centaurus
- 111 Hillcrest
- 234 Coral Rose Unit 49
- 112 Coral Rose Unit 107
- 109 Jadestone
- 108 Jadestone Unit 148
- 22 Arborside Unit 11
- 6286 Sierra Siena Rd
- 54 Valley Terrace
- 7 Altair
- 19172 Sierra Maria Rd
- 53 Sweet Bay
- 53 Oxford Unit 14
- 17 Oxford Unit 28
- 25 Village Way
- 5421 Catowba Ln
- 5431 Catowba Ln
- 5411 Catowba Ln
- 5402 Kenosha Ln
- 5396 Kenosha Ln
- 5441 Catowba Ln
- 5401 Catowba Ln
- 5412 Kenosha Ln
- 5392 Kenosha Ln
- 5422 Catowba Ln
- 5412 Catowba Ln
- 5451 Catowba Ln
- 5391 Catowba Ln
- 5402 Catowba Ln
- 5422 Kenosha Ln
- 5442 Catowba Ln
- 5382 Kenosha Ln
- 5392 Catowba Ln
- 5461 Catowba Ln
- 5452 Catowba Ln