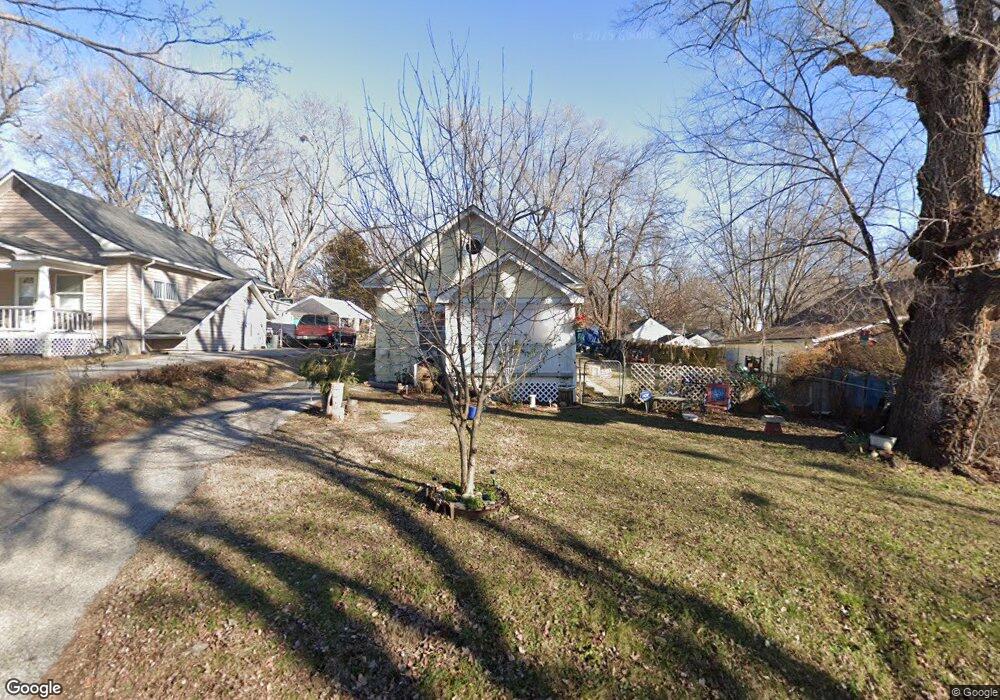
543 S Cedar Ave Independence, MO 64053
Fairmount NeighborhoodEstimated Value: $99,000 - $126,000
2
Beds
1
Bath
651
Sq Ft
$173/Sq Ft
Est. Value
About This Home
This home is located at 543 S Cedar Ave, Independence, MO 64053 and is currently estimated at $112,862, approximately $173 per square foot. 543 S Cedar Ave is a home located in Jackson County with nearby schools including Fairmount Elementary School, Clifford H. Nowlin Middle School, and Van Horn High School.
Ownership History
Date
Name
Owned For
Owner Type
Purchase Details
Closed on
Apr 6, 2021
Sold by
Possesses The Land Properties Llc
Bought by
Cox Anna and Cox Jesse
Current Estimated Value
Home Financials for this Owner
Home Financials are based on the most recent Mortgage that was taken out on this home.
Original Mortgage
$66,750
Outstanding Balance
$48,555
Interest Rate
2.8%
Mortgage Type
New Conventional
Estimated Equity
$64,307
Purchase Details
Closed on
Aug 14, 2009
Sold by
Hunner Gwendolyn S
Bought by
Hunner Gwendolyn S and Hunner Michael S
Purchase Details
Closed on
Feb 20, 2001
Sold by
Wright Stanley and Wright Sandra L
Bought by
Hunner Gwendolyn S
Home Financials for this Owner
Home Financials are based on the most recent Mortgage that was taken out on this home.
Original Mortgage
$27,000
Interest Rate
6.85%
Mortgage Type
Seller Take Back
Create a Home Valuation Report for This Property
The Home Valuation Report is an in-depth analysis detailing your home's value as well as a comparison with similar homes in the area
Home Values in the Area
Average Home Value in this Area
Purchase History
| Date | Buyer | Sale Price | Title Company |
|---|---|---|---|
| Cox Anna | -- | Title Clearing & Escrow | |
| Hunner Gwendolyn S | -- | None Available | |
| Hunner Gwendolyn S | -- | First American Title Ins |
Source: Public Records
Mortgage History
| Date | Status | Borrower | Loan Amount |
|---|---|---|---|
| Open | Cox Anna | $66,750 | |
| Previous Owner | Hunner Gwendolyn S | $27,000 |
Source: Public Records
Tax History
| Year | Tax Paid | Tax Assessment Tax Assessment Total Assessment is a certain percentage of the fair market value that is determined by local assessors to be the total taxable value of land and additions on the property. | Land | Improvement |
|---|---|---|---|---|
| 2025 | $853 | $12,062 | $3,162 | $8,900 |
| 2024 | $853 | $11,970 | $1,864 | $10,106 |
| 2023 | $833 | $11,970 | $1,469 | $10,501 |
| 2022 | $695 | $9,120 | $1,216 | $7,904 |
| 2021 | $692 | $9,120 | $1,216 | $7,904 |
| 2020 | $648 | $8,318 | $1,216 | $7,102 |
| 2019 | $639 | $8,318 | $1,216 | $7,102 |
| 2018 | $572 | $7,240 | $1,059 | $6,181 |
| 2016 | $571 | $7,058 | $1,370 | $5,688 |
Source: Public Records
Map
Nearby Homes
- 549 S Cedar Ave
- 511 S Cedar Ave
- 9822 E Independence Ave
- 526 S Hardy Ave
- 230 S Huttig Ave
- 705 S Hawthorne Ave
- 547 S Evanston Ave
- 10406 E Lexington Ave
- 804 S Home Ave
- 9707 E Wilson Rd
- 644 S Lake Dr
- 805 S Hardy Ave
- 213 S Willow Ave
- 807 S Hardy Ave
- 128 S Hardy Ave
- 823 S Huttig Ave
- 816 S Lake Dr
- 9409 E Independence Ave
- 556 S Carlisle Dr
- 10402 E Kentucky Rd
- 541 S Cedar Ave
- 539 S Cedar Ave
- 546 S Cedar Ave
- 551 S Cedar Ave
- 537 S Cedar Ave
- 544 S Cedar Ave
- 542 S Cedar Ave
- 534 S Huttig Ave
- 532 S Huttig Ave
- 533 S Cedar Ave
- 553 S Cedar Ave
- 536 S Huttig Ave
- 530 S Huttig Ave
- 538 S Cedar Ave
- 538 S Huttig Ave
- 528 S Huttig Ave
- 540 S Huttig Ave
- 534 S Cedar Ave
- 526 S Huttig Ave
- 542 S Huttig Ave Unit A
Your Personal Tour Guide
Ask me questions while you tour the home.