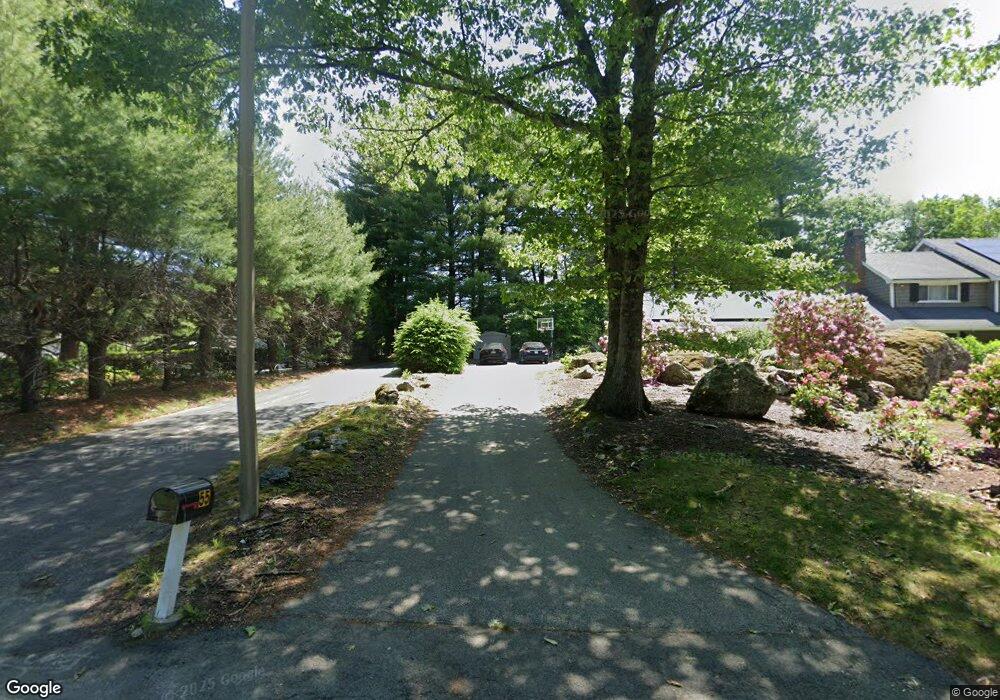
55 Algonquin Rd Canton, MA 02021
Estimated Value: $1,105,000 - $1,382,000
3
Beds
3
Baths
3,259
Sq Ft
$366/Sq Ft
Est. Value
About This Home
This home is located at 55 Algonquin Rd, Canton, MA 02021 and is currently estimated at $1,193,541, approximately $366 per square foot. 55 Algonquin Rd is a home located in Norfolk County with nearby schools including Canton High School, St. John the Evangelist School, and Beacon Scholastic Academy.
Ownership History
Date
Name
Owned For
Owner Type
Purchase Details
Closed on
Oct 25, 2019
Sold by
Bernotas Marci D
Bought by
Chapman Eva W and Chapman Catherine M
Current Estimated Value
Home Financials for this Owner
Home Financials are based on the most recent Mortgage that was taken out on this home.
Original Mortgage
$550,000
Outstanding Balance
$482,889
Interest Rate
3.5%
Mortgage Type
New Conventional
Estimated Equity
$710,652
Purchase Details
Closed on
Dec 10, 2009
Sold by
Bernotas David R and Bernotas Marci D
Bought by
Bernotas Marci D
Purchase Details
Closed on
Nov 13, 2003
Sold by
Logan Rt and Logan William L
Bought by
Bernotas David R and Bernotas Marci D
Home Financials for this Owner
Home Financials are based on the most recent Mortgage that was taken out on this home.
Original Mortgage
$660,000
Interest Rate
5.81%
Mortgage Type
Purchase Money Mortgage
Create a Home Valuation Report for This Property
The Home Valuation Report is an in-depth analysis detailing your home's value as well as a comparison with similar homes in the area
Home Values in the Area
Average Home Value in this Area
Purchase History
| Date | Buyer | Sale Price | Title Company |
|---|---|---|---|
| Chapman Eva W | $725,000 | -- | |
| Bernotas Marci D | -- | -- | |
| Bernotas David R | $825,000 | -- |
Source: Public Records
Mortgage History
| Date | Status | Borrower | Loan Amount |
|---|---|---|---|
| Open | Chapman Eva W | $550,000 | |
| Previous Owner | Bernotas David R | $660,000 | |
| Previous Owner | Bernotas David R | $125,000 |
Source: Public Records
Tax History
| Year | Tax Paid | Tax Assessment Tax Assessment Total Assessment is a certain percentage of the fair market value that is determined by local assessors to be the total taxable value of land and additions on the property. | Land | Improvement |
|---|---|---|---|---|
| 2025 | $9,723 | $983,100 | $397,000 | $586,100 |
| 2024 | $9,358 | $938,600 | $381,800 | $556,800 |
| 2023 | $9,033 | $854,600 | $381,800 | $472,800 |
| 2022 | $9,077 | $799,700 | $363,600 | $436,100 |
| 2021 | $8,834 | $724,100 | $330,500 | $393,600 |
| 2020 | $8,502 | $695,200 | $314,800 | $380,400 |
| 2019 | $8,343 | $672,800 | $286,100 | $386,700 |
| 2018 | $8,179 | $658,500 | $286,500 | $372,000 |
| 2017 | $8,326 | $651,000 | $280,900 | $370,100 |
| 2016 | $8,553 | $668,700 | $307,400 | $361,300 |
| 2015 | $8,286 | $646,300 | $298,500 | $347,800 |
Source: Public Records
Map
Nearby Homes
- 30 Green Lodge St
- 2253 Washington St Unit 2
- 2204 Davenport Ave Unit 2204
- 1 Sassamon St
- 130 University Ave Unit 1405
- 35 Turnpike St
- 360 Blue Hill Dr
- 350 Blue Hill Dr
- 42 Oakdale Rd
- 78 Cedarcrest Rd
- 22 Oakdale Rd
- 74 Cedarcrest Rd
- 215 Blue Hill Dr
- 25 Edward St
- 36 Cedarcrest Rd
- 15 Draper St
- 355 Canton St
- 193 Vincent Rd
- 94 Durham Rd
- 86 Durham Rd
Your Personal Tour Guide
Ask me questions while you tour the home.