551 Parkbrook St Spring Valley, CA 91977
Estimated Value: $626,000 - $733,000
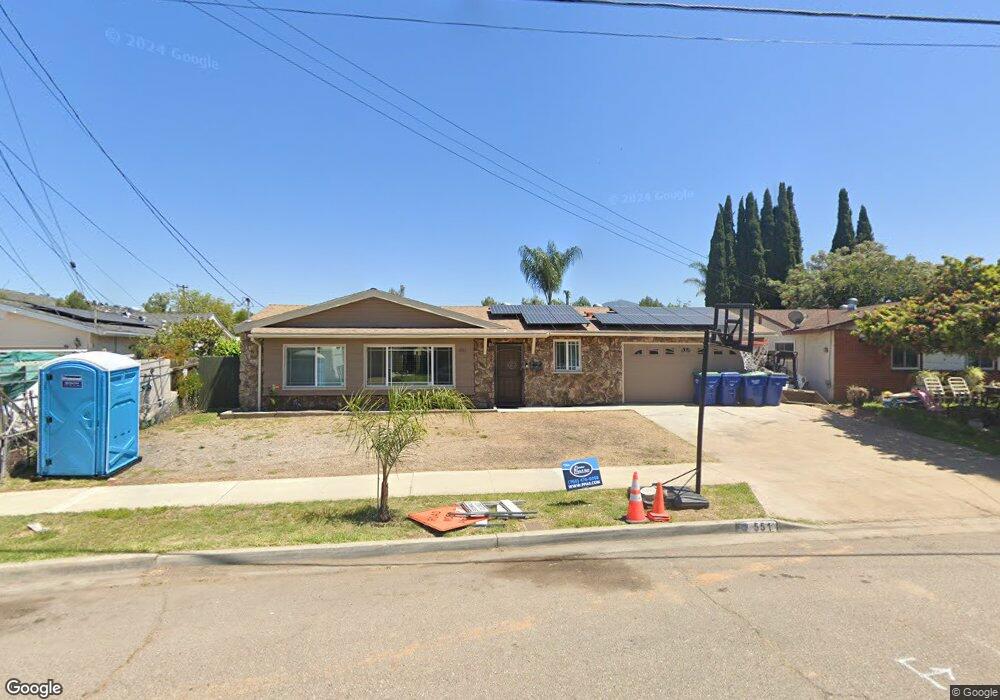
About This Home
This home is located at 551 Parkbrook St, Spring Valley, CA 91977 and is currently estimated at $689,289, approximately $653 per square foot. 551 Parkbrook St is a home located in San Diego County with nearby schools including Rancho Elementary School, Science, Technology, Engineering, Arts, And Math Academy, and Mount Miguel High School.
Ownership History
Purchase Details
Purchase Details
Home Financials for this Owner
Home Financials are based on the most recent Mortgage that was taken out on this home.Purchase Details
Home Financials for this Owner
Home Financials are based on the most recent Mortgage that was taken out on this home.Purchase Details
Home Financials for this Owner
Home Financials are based on the most recent Mortgage that was taken out on this home.Purchase Details
Home Financials for this Owner
Home Financials are based on the most recent Mortgage that was taken out on this home.Purchase Details
Home Financials for this Owner
Home Financials are based on the most recent Mortgage that was taken out on this home.Purchase Details
Home Financials for this Owner
Home Financials are based on the most recent Mortgage that was taken out on this home.Purchase Details
Purchase Details
Home Values in the Area
Average Home Value in this Area
Purchase History
We collect this data history from publicly available records. To have your information removed, we recommend requesting removal directly through your county’s website.
| Date | Buyer | Sale Price | Title Company |
|---|---|---|---|
| Gonzalez Living Trust | -- | None Listed On Document | |
| Gonzalez Eliseo | -- | None Listed On Document | |
| Gonzalez Eliseo | $200,000 | Ticor Title San Diego Branch | |
| Guill Richard T | -- | First American Title Co | |
| Guill Richard T | $455,000 | Southland Title Of San Diego | |
| Stephens Daneen | -- | First American Title Ins Co | |
| Stephens Daneen | -- | First American Title Ins Co | |
| Pearson Daneen | $235,500 | Lawyers Title | |
| Mcmeniman John | $131,000 | First American Title Co | |
| Wells Reginald Ethan | $14,536 | -- |
Mortgage History
We collect this data history from publicly available records. To have your information removed, we recommend requesting removal directly through your county’s website.
| Date | Status | Borrower | Loan Amount |
|---|---|---|---|
| Previous Owner | Gonzalez Eliseo | $193,300 | |
| Previous Owner | Guill Richard T | $69,000 | |
| Previous Owner | Guill Richard T | $368,000 | |
| Previous Owner | Guill Richard T | $91,000 | |
| Previous Owner | Guill Richard T | $364,000 | |
| Previous Owner | Stephens Daneen | $252,500 | |
| Previous Owner | Stephens Daneen | $252,500 | |
| Previous Owner | Pearson Daneen | $240,000 |
Tax History
| Year | Tax Paid | Tax Assessment Tax Assessment Total Assessment is a certain percentage of the fair market value that is determined by local assessors to be the total taxable value of land and additions on the property. | Land | Improvement |
|---|---|---|---|---|
| 2025 | $3,390 | $249,041 | $123,911 | $125,130 |
| 2024 | $3,390 | $244,159 | $121,482 | $122,677 |
| 2023 | $3,981 | $243,260 | $116,765 | $126,495 |
| 2022 | $3,303 | $243,260 | $116,765 | $126,495 |
| 2021 | $5,408 | $238,491 | $114,476 | $124,015 |
| 2020 | $5,250 | $236,047 | $113,303 | $122,744 |
| 2019 | $5,202 | $231,420 | $111,082 | $120,338 |
| 2018 | $2,986 | $226,883 | $108,904 | $117,979 |
| 2017 | $2,904 | $222,435 | $106,769 | $115,666 |
| 2016 | $2,790 | $218,075 | $104,676 | $113,399 |
| 2015 | $2,766 | $214,800 | $103,104 | $111,696 |
| 2014 | $2,724 | $210,594 | $101,085 | $109,509 |
Map
- 753 Elkelton Blvd
- 720 Safford Ave
- 617 Osage St
- 8740 Adriana St
- 738 Carlsbad St
- 8535 Paradise Valley Rd Unit 4
- 8766 Kelso St
- 709 Worthington St
- 9011 Joan St
- 8936 Orville St
- 901 Saint George Ct
- 835 Worthington St
- 8820 Ellenwood Cir
- 8840 Leigh Ave Unit 12
- 1040 Gillespie Dr
- 9125 Akard St
- 8808 Leigh Ave
- 238 Lakeview Ave
- 157 Lakeview Ave
- 552 Felicita Ave
- 555 Parkbrook St
- 545 Parkbrook St
- 558 Broadview St
- 556 Broadview St
- 564 Broadview St
- 541 Parkbrook St
- 552 Broadview St
- 548 Parkbrook St
- 570 Broadview St
- 552 Parkbrook St
- 544 Parkbrook St
- 550 Broadview St
- 558 Parkbrook St
- 539 Parkbrook St
- 540 Parkbrook St
- 546 Broadview St
- 577 Elkelton Blvd
- 605 Parkbrook St
- 571 Elkelton Blvd
- 606 Broadview St
Ask me questions while you tour the home.