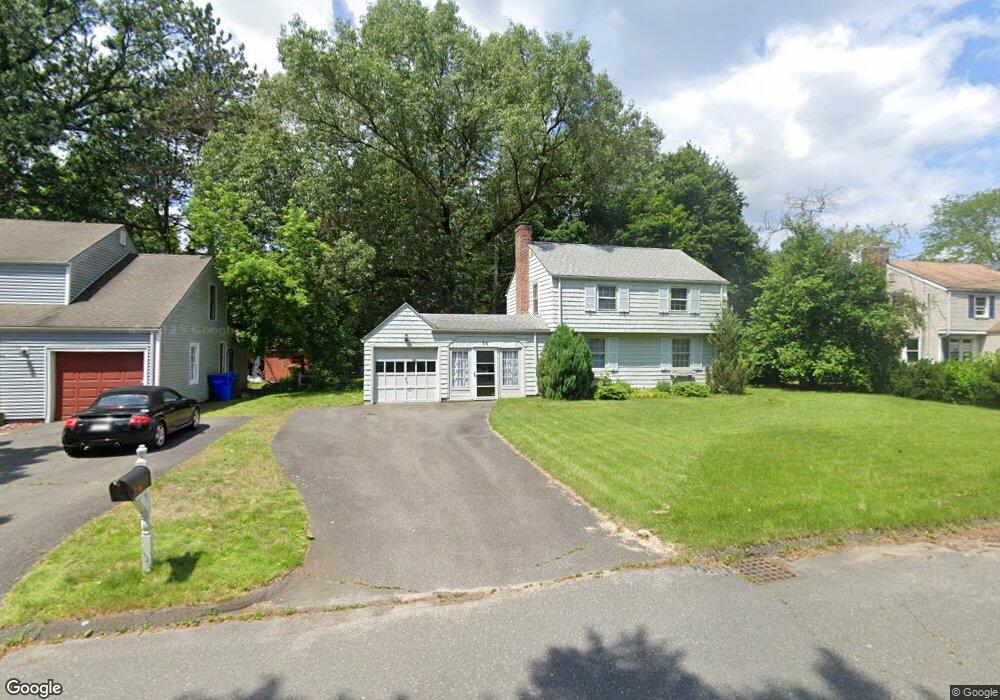
56 Donbray Rd Springfield, MA 01119
Sixteen Acres NeighborhoodEstimated Value: $197,000 - $333,000
3
Beds
2
Baths
1,092
Sq Ft
$225/Sq Ft
Est. Value
About This Home
This home is located at 56 Donbray Rd, Springfield, MA 01119 and is currently estimated at $246,183, approximately $225 per square foot. 56 Donbray Rd is a home located in Hampden County with nearby schools including Glickman Elementary, John J Duggan Middle, and Springfield High School of Science and Technology.
Ownership History
Date
Name
Owned For
Owner Type
Purchase Details
Closed on
Aug 22, 2025
Sold by
Anderson Laura K
Bought by
Anderson Maxwell C
Current Estimated Value
Home Financials for this Owner
Home Financials are based on the most recent Mortgage that was taken out on this home.
Original Mortgage
$150,000
Outstanding Balance
$149,739
Interest Rate
6.72%
Mortgage Type
New Conventional
Estimated Equity
$96,444
Purchase Details
Closed on
Sep 22, 2022
Sold by
Connors Jane A Est and Anderson
Bought by
Anderson Laura K
Create a Home Valuation Report for This Property
The Home Valuation Report is an in-depth analysis detailing your home's value as well as a comparison with similar homes in the area
Home Values in the Area
Average Home Value in this Area
Purchase History
| Date | Buyer | Sale Price | Title Company |
|---|---|---|---|
| Anderson Maxwell C | $190,000 | -- | |
| Anderson Maxwell C | $190,000 | -- | |
| Anderson Laura K | -- | None Available | |
| Anderson Laura K | -- | None Available |
Source: Public Records
Mortgage History
| Date | Status | Borrower | Loan Amount |
|---|---|---|---|
| Open | Anderson Maxwell C | $150,000 | |
| Closed | Anderson Maxwell C | $150,000 |
Source: Public Records
Tax History
| Year | Tax Paid | Tax Assessment Tax Assessment Total Assessment is a certain percentage of the fair market value that is determined by local assessors to be the total taxable value of land and additions on the property. | Land | Improvement |
|---|---|---|---|---|
| 2025 | $4,213 | $268,700 | $52,000 | $216,700 |
| 2024 | $4,150 | $258,400 | $52,000 | $206,400 |
| 2023 | $3,962 | $232,400 | $49,500 | $182,900 |
| 2022 | $3,862 | $205,200 | $49,500 | $155,700 |
| 2021 | $3,682 | $194,800 | $45,000 | $149,800 |
| 2020 | $3,424 | $175,300 | $45,000 | $130,300 |
| 2019 | $3,294 | $167,400 | $45,000 | $122,400 |
| 2018 | $3,256 | $165,600 | $45,000 | $120,600 |
| 2017 | $3,256 | $165,600 | $44,900 | $120,700 |
| 2016 | $3,089 | $157,100 | $44,900 | $112,200 |
| 2015 | $2,703 | $137,400 | $44,900 | $92,500 |
Source: Public Records
Map
Nearby Homes
- 381 N Brook Rd
- Lot 37 Kane St
- 108 Birchland Ave
- 46 Puritan Cir
- 186 Bolton St
- 235 Starling Rd
- 121 Mallowhill Rd
- 88 Senator St
- 25 Nassau Dr Unit 25
- 71 Nassau Dr
- 44 Nassau Dr
- 73 Timber Ln
- 854 Grayson Dr
- 74 Valley Rd
- 64 Wilmington St
- 130 Spear Rd
- 19 Annies Way
- 56 Contessa Ln
- 239 Gresham St
- 37 Middlebrook Dr
Your Personal Tour Guide
Ask me questions while you tour the home.