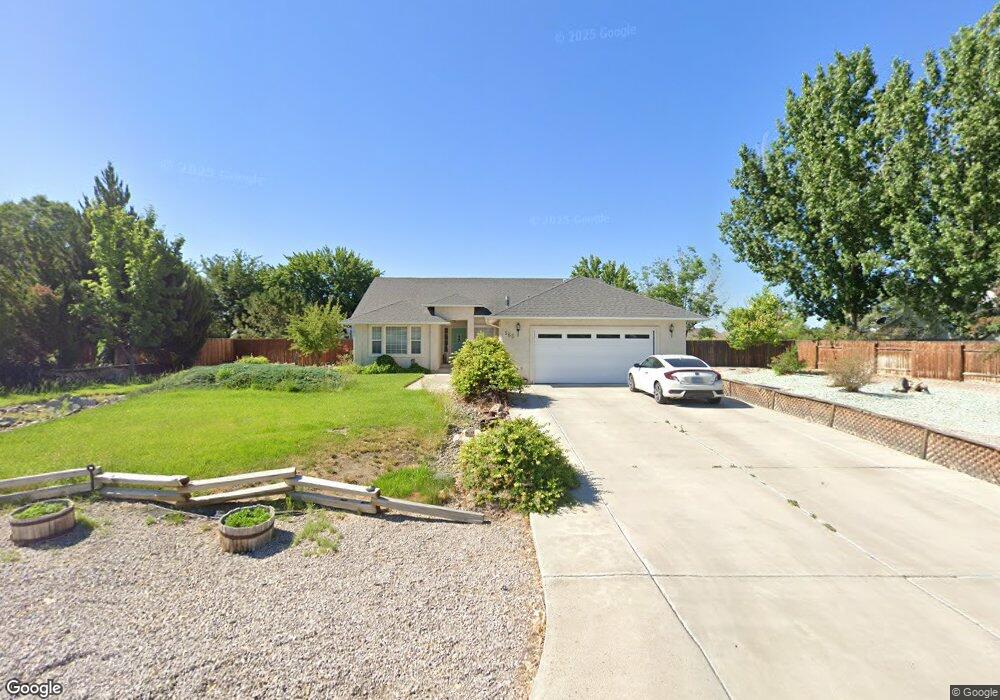
565 Hunter Park Way Fallon, NV 89406
Estimated Value: $430,206 - $511,000
3
Beds
2
Baths
2,532
Sq Ft
$192/Sq Ft
Est. Value
About This Home
This home is located at 565 Hunter Park Way, Fallon, NV 89406 and is currently estimated at $485,552, approximately $191 per square foot. 565 Hunter Park Way is a home located in Churchill County with nearby schools including E.C. Best Elementary School, Numa Elementary School, and Lahontan Elementary School.
Ownership History
Date
Name
Owned For
Owner Type
Purchase Details
Closed on
Oct 21, 2016
Sold by
Hertzog Stephanie
Bought by
Miller John H and Miller Rebecca J
Current Estimated Value
Purchase Details
Closed on
Oct 18, 2016
Sold by
Miller John H and Miller Rebecca J
Bought by
Miller John H and Miller Rebecca J
Create a Home Valuation Report for This Property
The Home Valuation Report is an in-depth analysis detailing your home's value as well as a comparison with similar homes in the area
Purchase History
| Date | Buyer | Sale Price | Title Company |
|---|---|---|---|
| Miller John H | -- | Attorney | |
| Miller John H | -- | Attorney |
Source: Public Records
Tax History
| Year | Tax Paid | Tax Assessment Tax Assessment Total Assessment is a certain percentage of the fair market value that is determined by local assessors to be the total taxable value of land and additions on the property. | Land | Improvement |
|---|---|---|---|---|
| 2025 | $2,462 | $118,689 | $22,750 | $95,939 |
| 2024 | $2,462 | $120,640 | $22,750 | $97,890 |
| 2023 | $2,462 | $112,553 | $22,750 | $89,803 |
| 2022 | $2,209 | $92,256 | $14,000 | $78,256 |
| 2021 | $2,140 | $91,170 | $14,000 | $77,170 |
| 2020 | $2,071 | $90,097 | $14,000 | $76,097 |
| 2019 | $1,997 | $80,311 | $14,000 | $66,311 |
| 2018 | $1,940 | $78,671 | $14,000 | $64,671 |
| 2017 | $1,881 | $73,479 | $8,750 | $64,729 |
| 2016 | $1,835 | $67,780 | $8,750 | $59,030 |
| 2015 | $1,760 | $64,167 | $8,750 | $55,417 |
| 2014 | $1,722 | $58,801 | $8,750 | $50,051 |
Source: Public Records
Map
Nearby Homes
- 1060 Penelope Dr
- 815 Great Basin Ln
- 806 Karry Way
- 119 Toiyabe Ln
- 882 Great Basin Ln
- 775 Karry Way
- 800 Great Basin Ln
- 120 Hunter Park Way
- 641 Megan Way
- 285 Amanda Ln
- 530 Michael Dr
- 728 Keppel St
- 1492 Del Rio Dr
- 621 Keppel St
- 618 Keppel St
- 604 Keppel St
- 343 Crystal Ct
- 604 Serpa Place
- 00 Serpa Place
- 1755 Coleman Rd
- 535 Hunter Park Way
- 595 Hunter Park Way
- 625 Hunter Park Way
- 550 Hunter Park Way
- 580 Hunter Park Way
- 290 Colorado Ln
- 368 Colorado Ln
- 655 Hunter Park Way
- 475 Hunter Park Way
- 332 Colorado Ln
- 274 Colorado Ln
- 384 Colorado Ln
- 520 Hunter Park Way
- 490 Hunter Park Way
- 222 Colorado Ln
- 640 Hunter Park Way
- 685 Hunter Park Way
- 402 Colorado Ln
- 445 Hunter Park Way
- 198 Colorado Ln
Your Personal Tour Guide
Ask me questions while you tour the home.