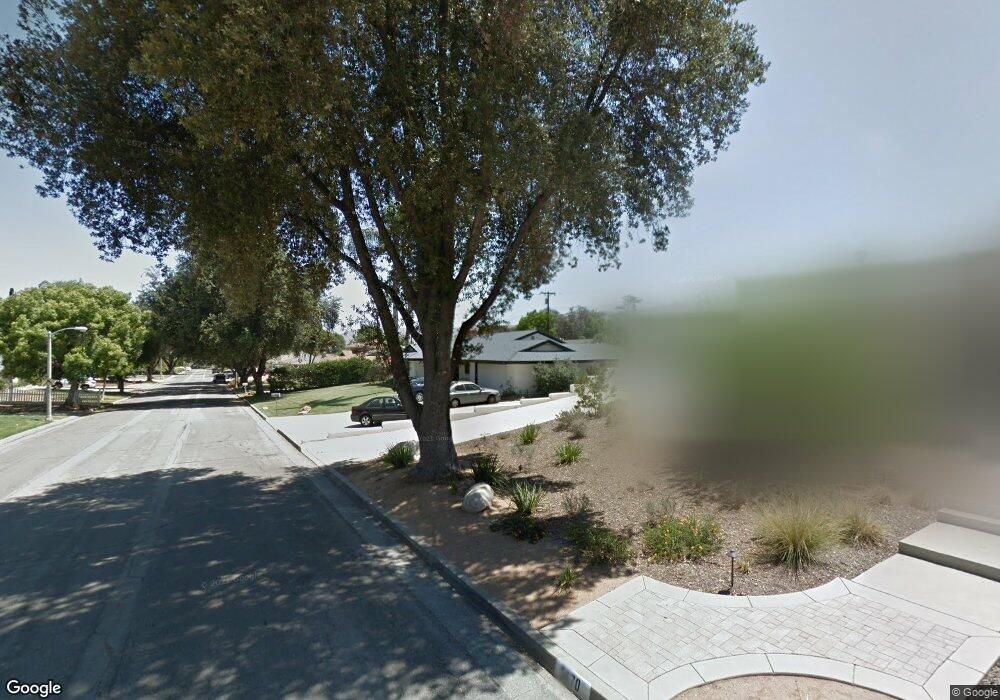
5658 Argyle Way Riverside, CA 92506
Victoria NeighborhoodEstimated Value: $801,000 - $820,000
3
Beds
3
Baths
1,890
Sq Ft
$430/Sq Ft
Est. Value
About This Home
This home is located at 5658 Argyle Way, Riverside, CA 92506 and is currently estimated at $812,661, approximately $429 per square foot. 5658 Argyle Way is a home located in Riverside County with nearby schools including Alcott Elementary School, Matthew Gage Middle School, and Polytechnic High School.
Ownership History
Date
Name
Owned For
Owner Type
Purchase Details
Closed on
Oct 27, 2005
Sold by
Friar Lynne
Bought by
Sweeney Steven and Sweeney Lisa
Current Estimated Value
Home Financials for this Owner
Home Financials are based on the most recent Mortgage that was taken out on this home.
Original Mortgage
$375,000
Outstanding Balance
$200,925
Interest Rate
5.68%
Mortgage Type
Fannie Mae Freddie Mac
Estimated Equity
$611,736
Purchase Details
Closed on
Oct 20, 2004
Sold by
Friar Sam and Friar Lynne
Bought by
Friar Sam and Friar Lynne
Purchase Details
Closed on
May 5, 1999
Sold by
Lingley Nancy Jane
Bought by
Lingley William J
Home Financials for this Owner
Home Financials are based on the most recent Mortgage that was taken out on this home.
Original Mortgage
$188,950
Interest Rate
6.92%
Mortgage Type
Purchase Money Mortgage
Create a Home Valuation Report for This Property
The Home Valuation Report is an in-depth analysis detailing your home's value as well as a comparison with similar homes in the area
Home Values in the Area
Average Home Value in this Area
Purchase History
| Date | Buyer | Sale Price | Title Company |
|---|---|---|---|
| Sweeney Steven | $525,000 | Alliance Title Company | |
| Friar Sam | -- | -- | |
| Lingley William J | -- | Ati Title | |
| Friar Sam | $210,000 | Ati Title |
Source: Public Records
Mortgage History
| Date | Status | Borrower | Loan Amount |
|---|---|---|---|
| Open | Sweeney Steven | $375,000 | |
| Previous Owner | Friar Sam | $188,950 |
Source: Public Records
Tax History
| Year | Tax Paid | Tax Assessment Tax Assessment Total Assessment is a certain percentage of the fair market value that is determined by local assessors to be the total taxable value of land and additions on the property. | Land | Improvement |
|---|---|---|---|---|
| 2025 | $7,687 | $717,430 | $122,978 | $594,452 |
| 2023 | $7,687 | $689,573 | $118,203 | $571,370 |
| 2022 | $7,509 | $676,053 | $115,886 | $560,167 |
| 2021 | $6,162 | $551,882 | $94,780 | $457,102 |
| 2020 | $5,516 | $492,752 | $84,625 | $408,127 |
| 2019 | $5,358 | $478,400 | $82,160 | $396,240 |
| 2018 | $5,152 | $460,000 | $79,000 | $381,000 |
| 2017 | $5,036 | $449,000 | $77,000 | $372,000 |
| 2016 | $4,645 | $434,000 | $74,000 | $360,000 |
| 2015 | $4,337 | $405,000 | $69,000 | $336,000 |
| 2014 | $4,111 | $380,000 | $65,000 | $315,000 |
Source: Public Records
Map
Nearby Homes
- 5593 Malvern Way
- 2130 Old Quarry Rd
- 2160 Falcon Crest Dr
- 5821 Sunset Ranch Dr
- 2078 Livingston St
- 2188 Ranchwood Place
- 5296 Bronson Way
- 2111 Elsinore Rd
- 2216 El Capitan Dr
- 6141 Bluffwood Dr
- 5305 Bardwell Ave
- 1450 Via Vallarta
- 2424 Central Ave
- 2252 El Capitan Dr
- 1420 Timberlane Dr
- 6213 Academy Ave
- 2565 Laramie Rd
- 2429 Chauncy Place
- 2667 Victoria Park Dr
- 6180 Shaker Dr
- 5670 Argyle Way
- 5657 Malvern Way
- 5636 Argyle Way
- 5635 Malvern Way
- 5645 Argyle Way
- 2007 Benedict Ave
- 5625 Argyle Way
- 5659 Argyle Way
- 2027 Benedict Ave
- 5620 Argyle Way
- 5690 Argyle Way
- 5621 Malvern Way
- 5607 Argyle Way
- 1989 Benedict Ave
- 5650 Glenhaven Ave
- 5632 Glenhaven Ave
- 5683 Argyle Way
- 5634 Malvern Way
- 5616 Glenhaven Ave
- 5668 Glenhaven Ave
Your Personal Tour Guide
Ask me questions while you tour the home.