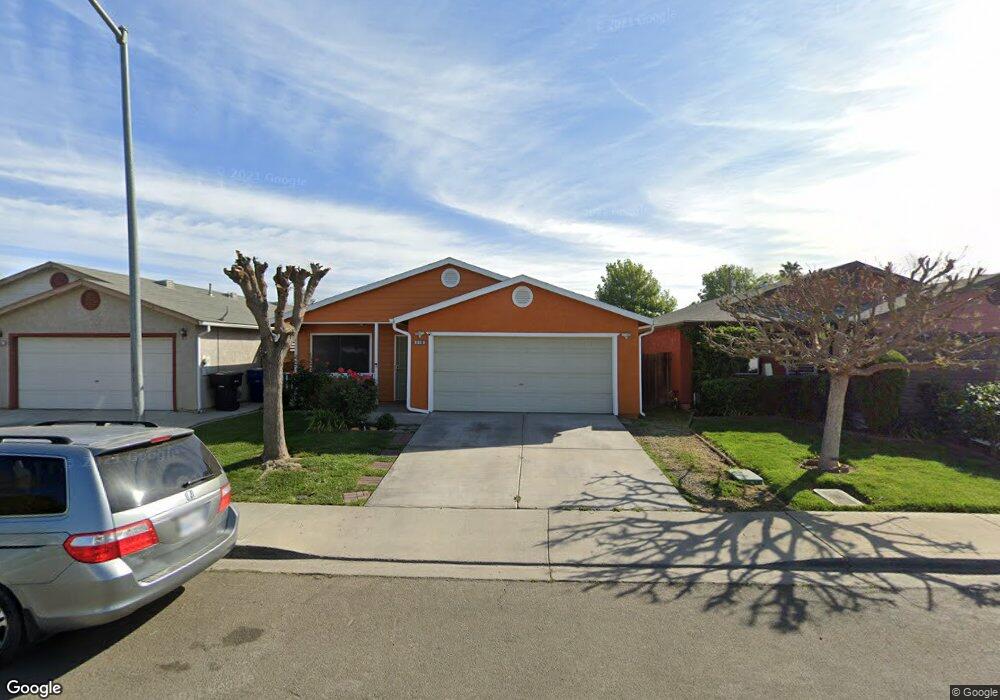
570 Logan Way Patterson, CA 95363
Estimated Value: $334,000 - $399,000
3
Beds
2
Baths
1,189
Sq Ft
$311/Sq Ft
Est. Value
About This Home
This home is located at 570 Logan Way, Patterson, CA 95363 and is currently estimated at $369,670, approximately $310 per square foot. 570 Logan Way is a home located in Stanislaus County with nearby schools including Walnut Grove Elementary School, Creekside Middle School, and Patterson High School.
Ownership History
Date
Name
Owned For
Owner Type
Purchase Details
Closed on
Oct 28, 2024
Sold by
Hernandez Laureano Sanchez and Barriga Miriam Sanchez
Bought by
Laosmica 2024 Family Rev Trust and Hernandez
Current Estimated Value
Purchase Details
Closed on
Oct 23, 2020
Sold by
Sanchez Laureano and Sanchez Luisa
Bought by
Hernandez Laureano Sanchez and Sanchez Luisa
Home Financials for this Owner
Home Financials are based on the most recent Mortgage that was taken out on this home.
Original Mortgage
$80,000
Interest Rate
2.8%
Mortgage Type
New Conventional
Purchase Details
Closed on
May 10, 2001
Sold by
Self Help Enterprises
Bought by
Sanchez Lauriano and Sanchez Maria Louisa
Home Financials for this Owner
Home Financials are based on the most recent Mortgage that was taken out on this home.
Original Mortgage
$84,603
Interest Rate
6.89%
Create a Home Valuation Report for This Property
The Home Valuation Report is an in-depth analysis detailing your home's value as well as a comparison with similar homes in the area
Home Values in the Area
Average Home Value in this Area
Purchase History
We collect this data history from publicly available records. To have your information removed, we recommend requesting removal directly through your county’s website.
| Date | Buyer | Sale Price | Title Company |
|---|---|---|---|
| Laosmica 2024 Family Rev Trust | -- | None Listed On Document | |
| Hernandez Laureano Sanchez | -- | North American Title Co Inc | |
| Sanchez Lauriano | $24,000 | Fidelity National Title Co |
Source: Public Records
Mortgage History
We collect this data history from publicly available records. To have your information removed, we recommend requesting removal directly through your county’s website.
| Date | Status | Borrower | Loan Amount |
|---|---|---|---|
| Previous Owner | Hernandez Laureano Sanchez | $80,000 | |
| Previous Owner | Sanchez Lauriano | $84,603 | |
| Closed | Sanchez Lauriano | $2,897 |
Source: Public Records
Tax History
| Year | Tax Paid | Tax Assessment Tax Assessment Total Assessment is a certain percentage of the fair market value that is determined by local assessors to be the total taxable value of land and additions on the property. | Land | Improvement |
|---|---|---|---|---|
| 2025 | $2,681 | $221,542 | $36,153 | $185,389 |
| 2024 | $2,668 | $217,199 | $35,445 | $181,754 |
| 2023 | $2,616 | $212,941 | $34,750 | $178,191 |
| 2022 | $2,472 | $208,767 | $34,069 | $174,698 |
| 2021 | $2,453 | $204,674 | $33,401 | $171,273 |
| 2020 | $2,440 | $202,576 | $33,059 | $169,517 |
| 2019 | $2,404 | $198,605 | $32,411 | $166,194 |
| 2018 | $2,292 | $194,712 | $31,776 | $162,936 |
| 2017 | $2,246 | $190,895 | $31,153 | $159,742 |
| 2016 | $2,188 | $187,153 | $30,543 | $156,610 |
| 2015 | $1,831 | $154,500 | $23,000 | $131,500 |
| 2014 | $1,589 | $133,000 | $20,000 | $113,000 |
Source: Public Records
Map
Nearby Homes
- 1430 Walnut Ave
- 608 Somerset Way
- 315 M St
- 673 Dorset Dr
- 801 Chatham Ln
- 809 Chatham Ln
- 800 Chatham Ln
- 817 Chatham Ln
- 821 Chatham Ln
- 816 Chatham Ln
- 829 Chatham Ln
- 820 Chatham Ln
- 817 Helmsley Ln
- 821 Helmsley Ln
- 816 Helmsley Ln
- 820 Helmsley Ln
- 140 Ivy Ave Unit A5
- 140 Ivy Ave Unit 39
- 154 Brook Hollow Dr
- 941 Arambel Dr
Your Personal Tour Guide
Ask me questions while you tour the home.