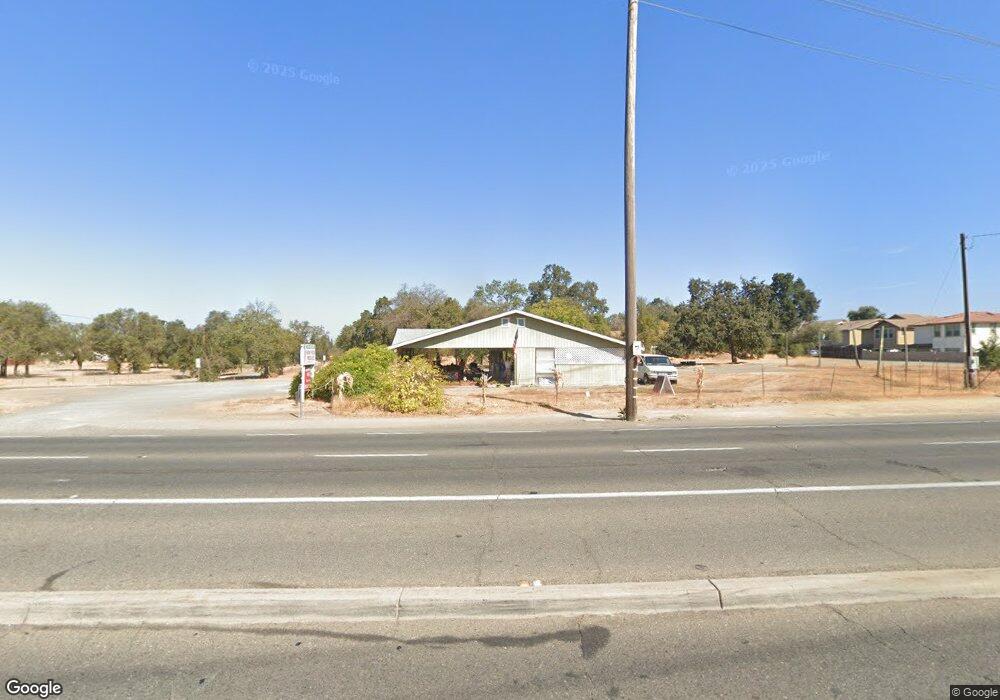
5701 Winding Way Carmichael, CA 95608
Del Paso Vale NeighborhoodEstimated Value: $586,000 - $1,683,546
2
Beds
2
Baths
1,612
Sq Ft
$704/Sq Ft
Est. Value
About This Home
This home is located at 5701 Winding Way, Carmichael, CA 95608 and is currently estimated at $1,134,773, approximately $703 per square foot. 5701 Winding Way is a home located in Sacramento County with nearby schools including Cameron Ranch Elementary School, Winston Churchill Middle School, and Mira Loma High School.
Ownership History
Date
Name
Owned For
Owner Type
Purchase Details
Closed on
May 6, 2009
Sold by
Gingerich Douglas
Bought by
Gingerich Douglas R and Gingerich Valerie
Current Estimated Value
Purchase Details
Closed on
Jul 5, 2005
Sold by
Maier Marjorie E and Gingerich Douglas
Bought by
Gingerich Douglas
Purchase Details
Closed on
Sep 17, 2004
Sold by
Gingerich Douglas
Bought by
Maier Marjorie E and Gingerich Douglas
Home Financials for this Owner
Home Financials are based on the most recent Mortgage that was taken out on this home.
Original Mortgage
$315,000
Outstanding Balance
$149,459
Interest Rate
5.25%
Mortgage Type
Unknown
Estimated Equity
$985,314
Purchase Details
Closed on
Sep 10, 1998
Sold by
Maier Marjorie Eileen
Bought by
Gingerich Maier Family Ltd Partnership
Purchase Details
Closed on
Jun 30, 1998
Sold by
Maier Marjorie and Gingerich Marjorie
Bought by
Maier Marjorie Eileen
Create a Home Valuation Report for This Property
The Home Valuation Report is an in-depth analysis detailing your home's value as well as a comparison with similar homes in the area
Home Values in the Area
Average Home Value in this Area
Purchase History
| Date | Buyer | Sale Price | Title Company |
|---|---|---|---|
| Gingerich Douglas R | -- | None Available | |
| Gingerich Douglas | -- | -- | |
| Maier Marjorie E | -- | Placer Title Company | |
| Gingerich Maier Family Ltd Partnership | -- | -- | |
| Maier Marjorie Eileen | -- | -- |
Source: Public Records
Mortgage History
| Date | Status | Borrower | Loan Amount |
|---|---|---|---|
| Open | Maier Marjorie E | $315,000 |
Source: Public Records
Tax History
| Year | Tax Paid | Tax Assessment Tax Assessment Total Assessment is a certain percentage of the fair market value that is determined by local assessors to be the total taxable value of land and additions on the property. | Land | Improvement |
|---|---|---|---|---|
| 2025 | $16,841 | $1,421,614 | $1,318,123 | $103,491 |
| 2024 | $16,841 | $1,393,740 | $1,292,278 | $101,462 |
| 2023 | $16,415 | $1,366,413 | $1,266,940 | $99,473 |
| 2022 | $16,330 | $1,339,622 | $1,242,099 | $97,523 |
| 2021 | $16,061 | $1,313,356 | $1,217,745 | $95,611 |
| 2020 | $15,762 | $1,299,890 | $1,205,259 | $94,631 |
| 2019 | $15,447 | $1,274,403 | $1,181,627 | $92,776 |
| 2018 | $15,270 | $1,249,415 | $1,158,458 | $90,957 |
| 2017 | $15,121 | $1,224,918 | $1,135,744 | $89,174 |
| 2016 | $14,128 | $1,200,901 | $1,113,475 | $87,426 |
| 2015 | $13,888 | $1,182,863 | $1,096,750 | $86,113 |
| 2014 | $13,600 | $1,159,694 | $1,075,267 | $84,427 |
Source: Public Records
Map
Nearby Homes
- 4660 Lue Ln
- 4656 Lue Ln
- 5500 Stately Oak Ln
- 4904 Manzanita Ave
- 5831 Verde Cruz Way
- 5865 Esrig Way
- 4822 Cameron Ranch Dr
- 5805 Muldrow Rd
- 0 Secluded Oaks Ln Unit 224011893
- 5861 Muldrow Rd
- 4812 Alexon Way
- 5042 Greenberry Dr
- 4309 Jan Dr
- 5100 Connecticut Dr
- 4312 Virgusell Cir
- 5320 Joline Ave Unit 5328
- 5412 Wildflower Cir
- 5145 Connecticut Dr
- 4907 Crestview Dr
- 5128 Rhode Island Dr
Your Personal Tour Guide
Ask me questions while you tour the home.