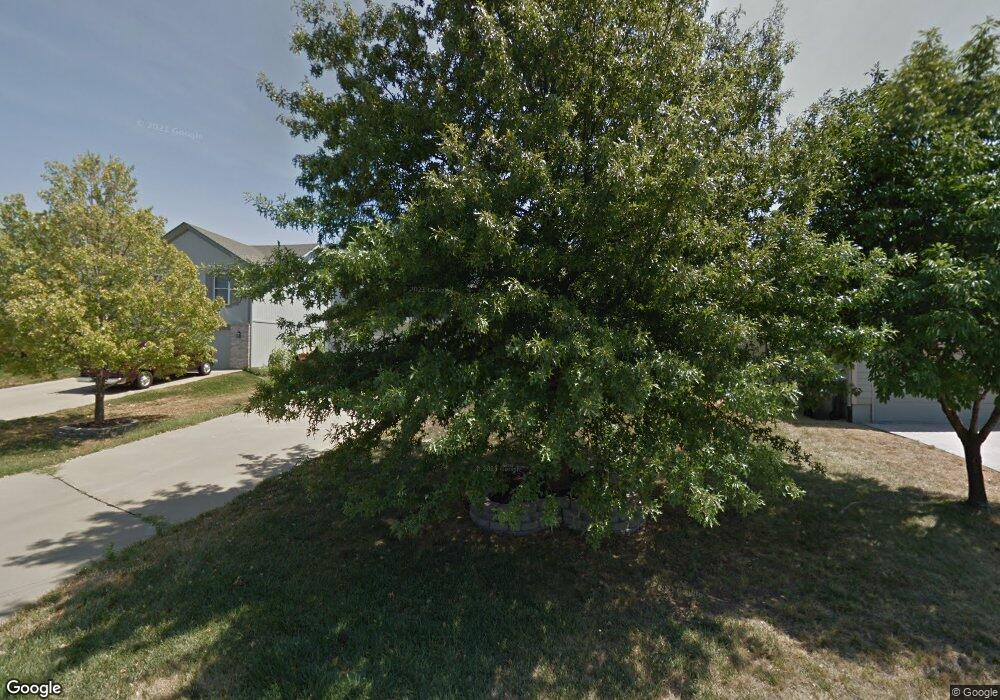
5713 Lakeridge Shawnee, KS 66218
Estimated Value: $422,000 - $457,000
4
Beds
4
Baths
1,610
Sq Ft
$269/Sq Ft
Est. Value
About This Home
This home is located at 5713 Lakeridge, Shawnee, KS 66218 and is currently estimated at $433,484, approximately $269 per square foot. 5713 Lakeridge is a home located in Johnson County with nearby schools including Clear Creek Elementary School, Monticello Trails Middle School, and Mill Valley High School.
Ownership History
Date
Name
Owned For
Owner Type
Purchase Details
Closed on
May 26, 2011
Sold by
Mccrary Stephanie D
Bought by
Walker Janel
Current Estimated Value
Home Financials for this Owner
Home Financials are based on the most recent Mortgage that was taken out on this home.
Original Mortgage
$183,150
Interest Rate
4.52%
Mortgage Type
New Conventional
Purchase Details
Closed on
Apr 23, 2007
Sold by
Donner Debra L
Bought by
Mccrary Stephanie D
Home Financials for this Owner
Home Financials are based on the most recent Mortgage that was taken out on this home.
Original Mortgage
$186,200
Interest Rate
6.13%
Mortgage Type
New Conventional
Purchase Details
Closed on
Mar 9, 2001
Sold by
Carney Clay and Carney Clayton P
Bought by
Donner Debra L
Home Financials for this Owner
Home Financials are based on the most recent Mortgage that was taken out on this home.
Original Mortgage
$130,000
Interest Rate
7.19%
Create a Home Valuation Report for This Property
The Home Valuation Report is an in-depth analysis detailing your home's value as well as a comparison with similar homes in the area
Home Values in the Area
Average Home Value in this Area
Purchase History
| Date | Buyer | Sale Price | Title Company |
|---|---|---|---|
| Walker Janel | -- | First American Title | |
| Mccrary Stephanie D | -- | First American Title Ins Co | |
| Donner Debra L | -- | Security Land Title Company |
Source: Public Records
Mortgage History
| Date | Status | Borrower | Loan Amount |
|---|---|---|---|
| Previous Owner | Walker Janel | $183,150 | |
| Previous Owner | Mccrary Stephanie D | $186,200 | |
| Previous Owner | Donner Debra L | $130,000 |
Source: Public Records
Tax History Compared to Growth
Tax History
| Year | Tax Paid | Tax Assessment Tax Assessment Total Assessment is a certain percentage of the fair market value that is determined by local assessors to be the total taxable value of land and additions on the property. | Land | Improvement |
|---|---|---|---|---|
| 2024 | $5,305 | $45,667 | $7,909 | $37,758 |
| 2023 | $4,962 | $42,217 | $7,909 | $34,308 |
| 2022 | $4,619 | $38,502 | $6,876 | $31,626 |
| 2021 | $4,289 | $34,327 | $6,250 | $28,077 |
| 2020 | $3,929 | $31,153 | $6,250 | $24,903 |
| 2019 | $3,911 | $30,555 | $5,160 | $25,395 |
| 2018 | $3,637 | $28,152 | $5,160 | $22,992 |
| 2017 | $3,617 | $27,313 | $4,684 | $22,629 |
| 2016 | $3,510 | $26,174 | $4,490 | $21,684 |
| 2015 | $3,469 | $25,473 | $4,490 | $20,983 |
| 2013 | -- | $22,862 | $4,490 | $18,372 |
Source: Public Records
Map
Nearby Homes
- 21315 W 56th St
- 21309 W 56th St
- 22209 W 57th St
- 21217 W 55th Terrace
- 22310 W 58th St
- 21624 W 53rd Terrace
- 5725 Marion St
- 5531 Hilltop Dr
- 5307 Noble St
- 5402 Roundtree St
- 5900 Redbud St
- 6031 Lakecrest Dr
- 5405 Lakecrest Dr
- 22605 W 56th St
- 5311 Brownridge Dr
- 21804 W 52nd Terrace
- 5408 Aminda St
- 5206 Round Prairie St
- 21609 W 61st St
- 6046 Redbud St
- 5717 Lakeridge
- 5709 Lakeridge
- 21720 W 57th Terrace
- 21716 W 57th Terrace
- 21724 W 57th Terrace
- 5705 Lakeridge
- 5714 Lakeridge
- 5718 Lakeridge
- 5702 Lakeridge
- 5710 Lakeridge
- 5706 Lakeridge
- 5725 Lakeridge
- 21712 W 57th Terrace
- 21737 W 56th St
- 21733 W 56th St
- 21624 W 58th St
- 5726 Lakeridge
- 5729 Lakeridge
- 21741 W 56th St
- 21708 W 57th Terrace