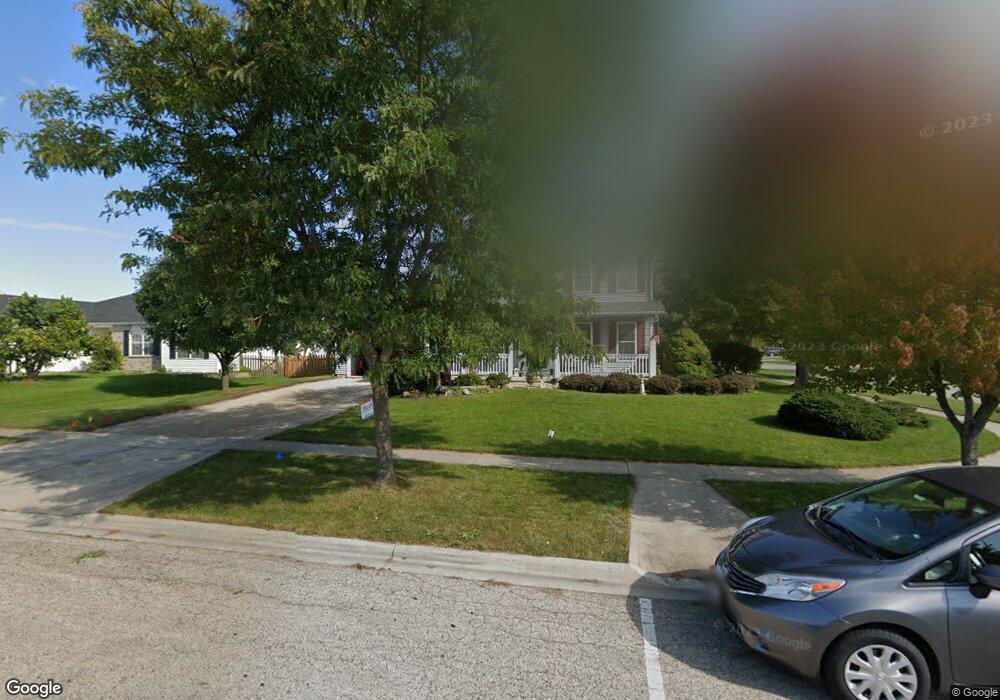
5718 Landcaster Cir McHenry, IL 60050
Estimated Value: $350,646 - $379,000
3
Beds
3
Baths
1,800
Sq Ft
$201/Sq Ft
Est. Value
About This Home
This home is located at 5718 Landcaster Cir, McHenry, IL 60050 and is currently estimated at $361,912, approximately $201 per square foot. 5718 Landcaster Cir is a home located in McHenry County with nearby schools including Riverwood Elementary School, Parkland School, and McHenry Community High School - Upper Campus.
Ownership History
Date
Name
Owned For
Owner Type
Purchase Details
Closed on
Nov 15, 2021
Sold by
Amsberry Edward C
Bought by
Edward C Amsberry Family Trust and Amsberry
Current Estimated Value
Purchase Details
Closed on
May 21, 2018
Sold by
Bennett Donald W and Bennett Sharon V
Bought by
Amsberry Edward C
Home Financials for this Owner
Home Financials are based on the most recent Mortgage that was taken out on this home.
Original Mortgage
$216,015
Interest Rate
5.25%
Mortgage Type
FHA
Purchase Details
Closed on
Sep 27, 2007
Sold by
Bennett Donald W and Bennett Sharon V
Bought by
Bennett Donald W and Bennett Sharon
Purchase Details
Closed on
Jan 22, 2002
Sold by
First Midwest Bank
Bought by
Hogman Mark S and Hogman Sheri
Home Financials for this Owner
Home Financials are based on the most recent Mortgage that was taken out on this home.
Original Mortgage
$138,800
Interest Rate
7.26%
Create a Home Valuation Report for This Property
The Home Valuation Report is an in-depth analysis detailing your home's value as well as a comparison with similar homes in the area
Home Values in the Area
Average Home Value in this Area
Purchase History
| Date | Buyer | Sale Price | Title Company |
|---|---|---|---|
| Edward C Amsberry Family Trust | -- | Salerno Frank | |
| Amsberry Edward C | $220,000 | Old Republic Title | |
| Bennett Donald W | -- | None Available | |
| Hogman Mark S | $173,524 | -- |
Source: Public Records
Mortgage History
| Date | Status | Borrower | Loan Amount |
|---|---|---|---|
| Previous Owner | Amsberry Edward C | $216,015 | |
| Previous Owner | Hogman Mark S | $138,800 |
Source: Public Records
Tax History Compared to Growth
Tax History
| Year | Tax Paid | Tax Assessment Tax Assessment Total Assessment is a certain percentage of the fair market value that is determined by local assessors to be the total taxable value of land and additions on the property. | Land | Improvement |
|---|---|---|---|---|
| 2024 | $6,309 | $90,583 | $21,021 | $69,562 |
| 2023 | $6,758 | $81,153 | $18,833 | $62,320 |
| 2022 | $6,811 | $77,697 | $17,472 | $60,225 |
| 2021 | $6,492 | $72,357 | $16,271 | $56,086 |
| 2020 | $6,272 | $69,341 | $15,593 | $53,748 |
| 2019 | $6,171 | $65,845 | $14,807 | $51,038 |
| 2018 | $5,943 | $62,860 | $14,136 | $48,724 |
| 2017 | $5,417 | $56,890 | $13,267 | $43,623 |
| 2016 | $5,186 | $53,168 | $12,399 | $40,769 |
| 2013 | -- | $49,093 | $12,207 | $36,886 |
Source: Public Records
Map
Nearby Homes
- 615 Cartwright Trail
- 1113 Draper Rd
- 1029 Draper Rd
- 1246 Draper Rd
- 1001 Draper Rd
- 509 Legend Ln Unit 224
- 507 Legend Ln
- 715 Legend Ln Unit 715
- 207 N Creekside Trail Unit B
- 419 N Thornwood Dr Unit A
- 6411 Longford Dr
- 607 Silbury Ct
- 5011 Sandburg Dr
- 5114 W Malibu Ct
- 4913 W Oakwood Dr Unit B
- 6409 Donegal Ln
- 5320 Cobblers Crossing Unit 173
- 1606 Tecumseh Dr
- 5321 Cobblers Crossing Unit 5321
- 217 Barnwood Trail
- 5800 Landcaster Cir Unit 4
- 5710 Landcaster Cir
- 5811 Landcaster Cir Unit 4
- 5715 Landcaster Cir
- 5717 Landcaster Cir
- 5823 Landcaster Cir Unit 4
- 5723 Landcaster Cir
- 5706 Landcaster Cir
- 5711 Landcaster Cir
- 5801 Landcaster Cir
- 5721 Landcaster Cir Unit 4
- 5827 Landcaster Cir
- 5719 Landcaster Cir Unit 4
- 5805 Landcaster Cir Unit 4
- 5707 Landcaster Cir
- 5702 Landcaster Cir
- 5710 Cobblestone Trail Unit 4
- 5831 Landcaster Cir Unit 4
- 5706 Cobblestone Trail
- 5712 Cobblestone Trail Unit 4