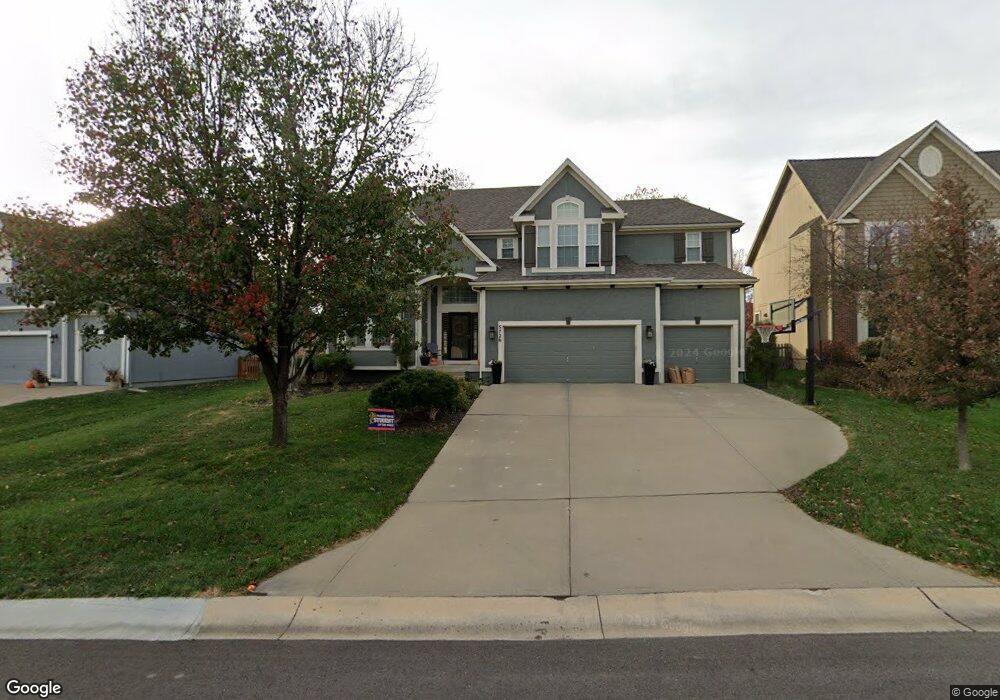
5726 Brockway St Shawnee, KS 66226
Estimated Value: $520,030 - $564,000
4
Beds
5
Baths
2,469
Sq Ft
$222/Sq Ft
Est. Value
About This Home
This home is located at 5726 Brockway St, Shawnee, KS 66226 and is currently estimated at $548,508, approximately $222 per square foot. 5726 Brockway St is a home located in Johnson County with nearby schools including Prairie Ridge Elementary School, Monticello Trails Middle School, and Mill Valley High School.
Ownership History
Date
Name
Owned For
Owner Type
Purchase Details
Closed on
Jun 14, 2010
Sold by
Lancaster Brian and Lancaster Kristen
Bought by
Brueggemann Jereme J and Brueggemann Barbara L
Current Estimated Value
Home Financials for this Owner
Home Financials are based on the most recent Mortgage that was taken out on this home.
Original Mortgage
$260,000
Outstanding Balance
$173,910
Interest Rate
4.93%
Mortgage Type
New Conventional
Estimated Equity
$374,598
Purchase Details
Closed on
Aug 4, 2004
Sold by
Concord Homes Llc
Bought by
Lancaster Brian and Lancaster Kristen
Home Financials for this Owner
Home Financials are based on the most recent Mortgage that was taken out on this home.
Original Mortgage
$208,600
Interest Rate
4.87%
Mortgage Type
Purchase Money Mortgage
Create a Home Valuation Report for This Property
The Home Valuation Report is an in-depth analysis detailing your home's value as well as a comparison with similar homes in the area
Home Values in the Area
Average Home Value in this Area
Purchase History
| Date | Buyer | Sale Price | Title Company |
|---|---|---|---|
| Brueggemann Jereme J | -- | Chicago Title Ins Co | |
| Lancaster Brian | -- | Security Land Title Company |
Source: Public Records
Mortgage History
| Date | Status | Borrower | Loan Amount |
|---|---|---|---|
| Open | Brueggemann Jereme J | $260,000 | |
| Previous Owner | Lancaster Brian | $208,600 | |
| Closed | Lancaster Brian | $39,100 |
Source: Public Records
Tax History Compared to Growth
Tax History
| Year | Tax Paid | Tax Assessment Tax Assessment Total Assessment is a certain percentage of the fair market value that is determined by local assessors to be the total taxable value of land and additions on the property. | Land | Improvement |
|---|---|---|---|---|
| 2024 | $6,188 | $53,130 | $9,391 | $43,739 |
| 2023 | $6,085 | $51,727 | $8,940 | $42,787 |
| 2022 | $5,783 | $48,162 | $8,515 | $39,647 |
| 2021 | $5,268 | $42,216 | $7,738 | $34,478 |
| 2020 | $5,151 | $44,493 | $7,738 | $36,755 |
| 2019 | $5,533 | $43,309 | $7,036 | $36,273 |
| 2018 | $5,130 | $39,790 | $6,399 | $33,391 |
| 2017 | $5,218 | $39,491 | $5,560 | $33,931 |
| 2016 | $4,999 | $37,363 | $5,560 | $31,803 |
| 2015 | $4,913 | $36,041 | $5,560 | $30,481 |
| 2013 | -- | $33,534 | $5,560 | $27,974 |
Source: Public Records
Map
Nearby Homes
- 5722 Payne St
- 22209 W 57th St
- 22310 W 58th St
- 5531 Hilltop Dr
- 22605 W 56th St
- 24621 W 60th St
- 5402 Roundtree St
- 21315 W 56th St
- 5408 Aminda St
- 21309 W 56th St
- 21624 W 53rd Terrace
- 6031 Lakecrest Dr
- 21217 W 55th Terrace
- 5725 Marion St
- 21609 W 61st St
- 5900 Redbud St
- 5307 Noble St
- 5206 Round Prairie St
- 21804 W 52nd Terrace
- 6358 Hilltop St
- 5722 Brockway St
- 5732 Brockway St
- 22115 Clear Creek Pkwy
- 5718 Brockway St
- 5736 Brockway St
- 22111 Clear Creek Pkwy
- 5725 Brockway St
- 5729 Brockway St
- 5721 Brockway St
- 22119 Clear Creek Pkwy
- 5733 Brockway St
- 5737 Brockway St
- 22106 W 58th St
- 22102 W 58th St
- 22110 W 58th St
- 5741 Brockway St
- 22114 W 58th St
- 22123 Clear Creek Pkwy
- 22013 W 57th Terrace
- 22009 W 57th Terrace