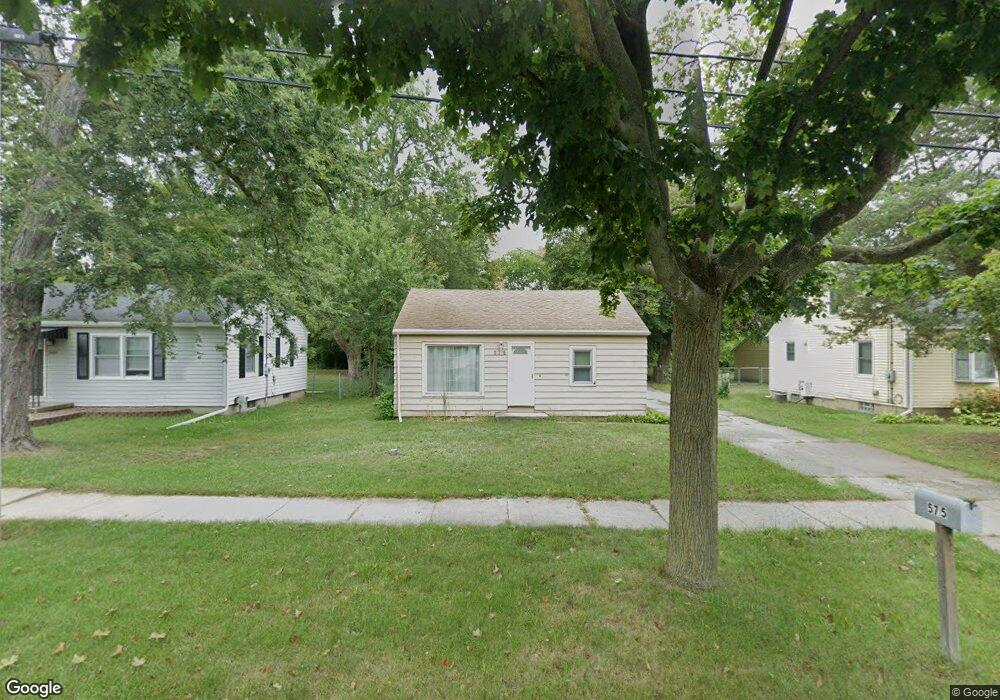
575 Armstrong Rd Lansing, MI 48911
Southern Lansing NeighborhoodEstimated Value: $120,000 - $155,000
3
Beds
1
Bath
1,104
Sq Ft
$123/Sq Ft
Est. Value
About This Home
This home is located at 575 Armstrong Rd, Lansing, MI 48911 and is currently estimated at $135,927, approximately $123 per square foot. 575 Armstrong Rd is a home located in Ingham County with nearby schools including Kendon School, Attwood School, and Everett High School.
Ownership History
Date
Name
Owned For
Owner Type
Purchase Details
Closed on
Jul 29, 2022
Sold by
Stevenson Bobby D and Stevenson Darshann C
Bought by
Stevenson Bobby D and Stevenson Darshann C
Current Estimated Value
Purchase Details
Closed on
Apr 10, 2013
Sold by
Stevenson Bobby D and Stevenson Bobby
Bought by
Stevenson Bobby D and Stevenson Darshann C
Purchase Details
Closed on
Mar 30, 2006
Sold by
Teelon Elaine M and Teelon Gene F
Bought by
Jpmorgan Chase Bank and Abfs Mortgage Loan Trust 2003-1
Purchase Details
Closed on
Dec 2, 2004
Sold by
Teelon Elaine M and Teelon Gene E
Bought by
Home American Credit Inc and Upland Mortgage
Purchase Details
Closed on
May 29, 1998
Sold by
Stark Marlene F
Bought by
Teelon Gene E and Teelon Elaine M
Create a Home Valuation Report for This Property
The Home Valuation Report is an in-depth analysis detailing your home's value as well as a comparison with similar homes in the area
Home Values in the Area
Average Home Value in this Area
Purchase History
| Date | Buyer | Sale Price | Title Company |
|---|---|---|---|
| Stevenson Bobby D | -- | None Listed On Document | |
| Stevenson Bobby D | -- | None Available | |
| Jpmorgan Chase Bank | $69,900 | None Available | |
| Home American Credit Inc | $73,593 | -- | |
| Teelon Gene E | $58,000 | -- |
Source: Public Records
Tax History Compared to Growth
Tax History
| Year | Tax Paid | Tax Assessment Tax Assessment Total Assessment is a certain percentage of the fair market value that is determined by local assessors to be the total taxable value of land and additions on the property. | Land | Improvement |
|---|---|---|---|---|
| 2025 | $2,476 | $64,900 | $13,100 | $51,800 |
| 2024 | $19 | $54,100 | $13,100 | $41,000 |
| 2023 | $2,323 | $49,900 | $13,100 | $36,800 |
| 2022 | $2,690 | $43,200 | $12,200 | $31,000 |
| 2021 | $2,628 | $39,800 | $8,400 | $31,400 |
| 2020 | $2,609 | $38,100 | $8,400 | $29,700 |
| 2019 | $2,521 | $36,600 | $8,400 | $28,200 |
| 2018 | $2,390 | $31,700 | $8,400 | $23,300 |
| 2017 | $2,301 | $31,700 | $8,400 | $23,300 |
| 2016 | $2,210 | $31,300 | $8,400 | $22,900 |
| 2015 | $2,210 | $30,500 | $16,756 | $13,744 |
| 2014 | $2,210 | $29,400 | $20,945 | $8,455 |
Source: Public Records
Map
Nearby Homes
- 4922 Southgate Ave
- 5724 Orchard Ct
- 1101 Barr Ave
- 5751 Joshua St
- 5750 Orchard Ct
- 5808 Orchard Ct
- 129 Village Dr
- 5011 Stafford Ave
- 201 E Syringa Dr
- 4719 S Pennsylvania Ave
- 5727 Annapolis Dr
- 105 Cox Blvd
- 629 Emily Ave
- 5636 Ellendale Dr
- 4800 Ora St
- 111 E Potter Ave
- 4317 S Cedar St
- 600 E Cavanaugh Rd
- 522 E Cavanaugh Rd
- 713 E Cavanaugh Rd
- 569 Armstrong Rd
- 609 Armstrong Rd
- 565 Armstrong Rd
- 615 Armstrong Rd
- 559 Armstrong Rd
- 574 Armstrong Rd
- 568 Armstrong Rd
- 602 Armstrong Rd
- 619 Armstrong Rd
- 551 Armstrong Rd
- 564 Armstrong Rd
- 614 Armstrong Rd
- 558 Armstrong Rd
- 547 Armstrong Rd
- 608 Armstrong Rd
- 552 Armstrong Rd
- 543 Armstrong Rd
- 618 Armstrong Rd
- 546 Armstrong Rd
- 622 Armstrong Rd