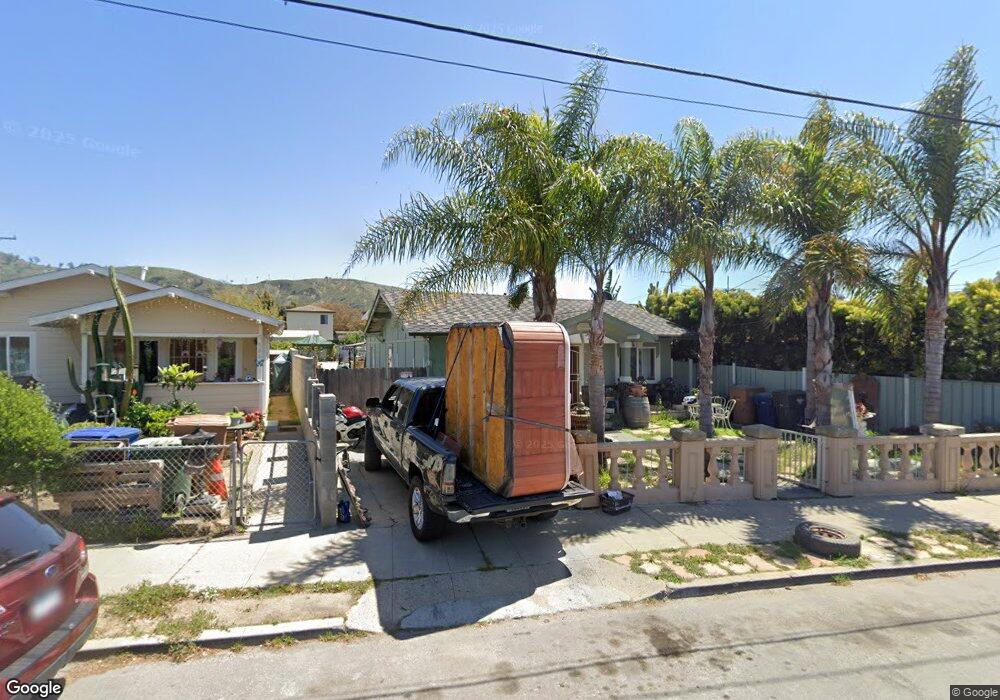
576 Sheridan Way Ventura, CA 93001
Westside NeighborhoodEstimated Value: $605,000 - $879,000
2
Beds
1
Bath
1,064
Sq Ft
$696/Sq Ft
Est. Value
About This Home
This home is located at 576 Sheridan Way, Ventura, CA 93001 and is currently estimated at $740,870, approximately $696 per square foot. 576 Sheridan Way is a home located in Ventura County with nearby schools including Will Rogers Elementary School, De Anza Academy Of Technology And The Arts, and Ventura High School.
Ownership History
Date
Name
Owned For
Owner Type
Purchase Details
Closed on
Mar 27, 2019
Sold by
Banates Aurora Irene
Bought by
Solis Jose
Current Estimated Value
Home Financials for this Owner
Home Financials are based on the most recent Mortgage that was taken out on this home.
Original Mortgage
$320,000
Outstanding Balance
$280,761
Interest Rate
4.3%
Mortgage Type
New Conventional
Estimated Equity
$460,109
Purchase Details
Closed on
Mar 8, 2019
Sold by
Ulloa Solis Ruben and Ulloa Napoles Yolanda
Bought by
Solis Ruben and Solis Jose
Home Financials for this Owner
Home Financials are based on the most recent Mortgage that was taken out on this home.
Original Mortgage
$320,000
Outstanding Balance
$280,761
Interest Rate
4.3%
Mortgage Type
New Conventional
Estimated Equity
$460,109
Purchase Details
Closed on
Dec 15, 2004
Sold by
Solis Ruben
Bought by
Solis Ruben and Solis Yolanda
Home Financials for this Owner
Home Financials are based on the most recent Mortgage that was taken out on this home.
Original Mortgage
$277,000
Interest Rate
5.8%
Mortgage Type
New Conventional
Purchase Details
Closed on
Aug 11, 2003
Sold by
Solis Javier
Bought by
Solis Ruben
Create a Home Valuation Report for This Property
The Home Valuation Report is an in-depth analysis detailing your home's value as well as a comparison with similar homes in the area
Home Values in the Area
Average Home Value in this Area
Purchase History
| Date | Buyer | Sale Price | Title Company |
|---|---|---|---|
| Solis Jose | -- | Priority Title | |
| Solis Ruben | $160,000 | Priority Title | |
| Solis Ruben | -- | New Century Title Company Lo | |
| Solis Ruben | -- | -- |
Source: Public Records
Mortgage History
| Date | Status | Borrower | Loan Amount |
|---|---|---|---|
| Open | Solis Ruben | $320,000 | |
| Previous Owner | Solis Ruben | $277,000 |
Source: Public Records
Tax History Compared to Growth
Tax History
| Year | Tax Paid | Tax Assessment Tax Assessment Total Assessment is a certain percentage of the fair market value that is determined by local assessors to be the total taxable value of land and additions on the property. | Land | Improvement |
|---|---|---|---|---|
| 2025 | $4,308 | $393,838 | $285,857 | $107,981 |
| 2024 | $4,308 | $386,116 | $280,252 | $105,864 |
| 2023 | $4,257 | $378,546 | $274,757 | $103,789 |
| 2022 | $3,966 | $371,124 | $269,370 | $101,754 |
| 2021 | $3,891 | $363,848 | $264,089 | $99,759 |
| 2020 | $3,854 | $360,119 | $261,382 | $98,737 |
| 2019 | $3,690 | $344,116 | $299,514 | $44,602 |
| 2018 | $3,630 | $337,370 | $293,642 | $43,728 |
| 2017 | $3,554 | $330,756 | $287,885 | $42,871 |
| 2016 | $4,615 | $324,272 | $282,241 | $42,031 |
| 2015 | $3,444 | $319,402 | $278,002 | $41,400 |
| 2014 | $3,145 | $290,000 | $252,000 | $38,000 |
Source: Public Records
Map
Nearby Homes
- 657 Sheridan Way
- 467 W Simpson St
- 367 W Harrison Ave
- 295 W Mission Ave
- 326 W Mission Ave
- 557 561 N North Olive St
- 885 Riverside St
- 285 N Ventura Ave Unit 5
- 285 N Ventura Ave Unit 6
- 100 E Center St
- 323 Wall St
- 257 Cedar St
- 130 N Garden St Unit 3248
- 281 W Main St
- 49 Mission Plaza Dr Unit 30
- 0 Cedar St Unit PW25039713
- 104 W Santa Clara St Unit 16
- 216 E Lewis St
- 47 W Mcfarlane Dr
- 47 W Mcfarlane St
- 586 Sheridan Way
- 383 W Center St
- 596 Sheridan Way
- 355 W Center St
- 330 W Simpson St
- 345 W Center St
- 331 W Center St
- 351 W Simpson St
- 310 W Simpson St
- 321 W Center St
- 347 W Simpson St
- 300 W Simpson St
- 307 W Center St
- 335 W Simpson St Unit 3
- 335 W Simpson St Unit C
- 335 W Simpson St Unit B
- 335 W Simpson St
- 335 W Simpson St
- 520 Sheridan Way
- 615 Sheridan Way