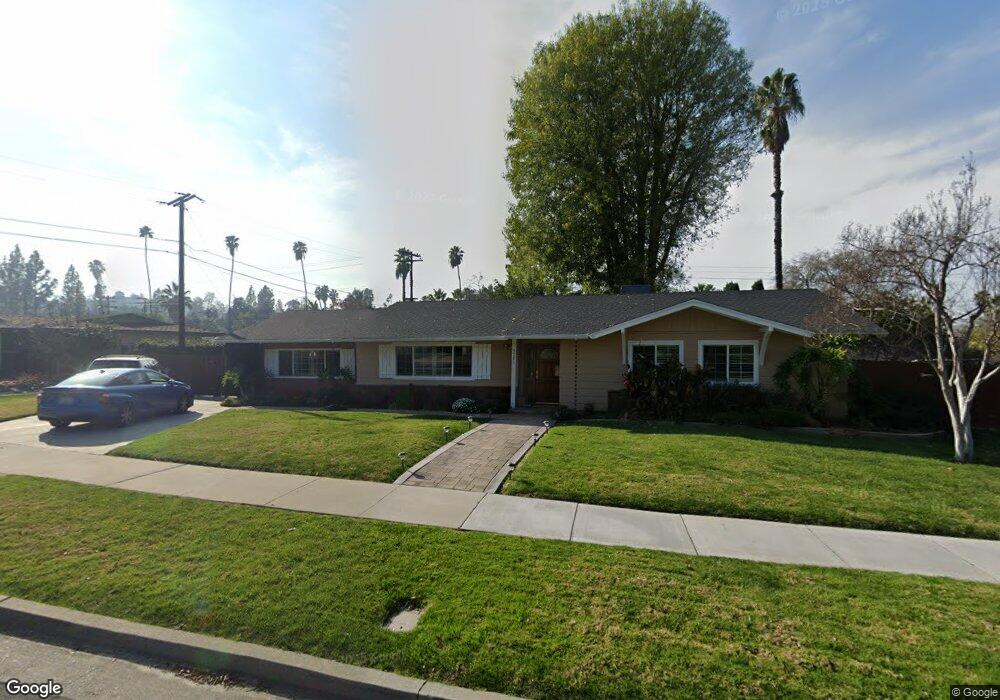
5761 Argyle Way Unit 1 Riverside, CA 92506
Victoria NeighborhoodEstimated Value: $764,168 - $825,000
5
Beds
3
Baths
2,156
Sq Ft
$372/Sq Ft
Est. Value
About This Home
This home is located at 5761 Argyle Way Unit 1, Riverside, CA 92506 and is currently estimated at $802,042, approximately $372 per square foot. 5761 Argyle Way Unit 1 is a home located in Riverside County with nearby schools including Alcott Elementary School, Matthew Gage Middle School, and Polytechnic High School.
Ownership History
Date
Name
Owned For
Owner Type
Purchase Details
Closed on
Feb 12, 2020
Sold by
Sue Sandra Ah
Bought by
Gunnell Don Alan and Gunnell Emily Paula
Current Estimated Value
Home Financials for this Owner
Home Financials are based on the most recent Mortgage that was taken out on this home.
Original Mortgage
$451,600
Outstanding Balance
$398,322
Interest Rate
3.4%
Mortgage Type
New Conventional
Estimated Equity
$403,720
Purchase Details
Closed on
Feb 1, 2016
Sold by
Corry Steven Robert
Bought by
Sue Sandra Ah
Purchase Details
Closed on
Jan 18, 2016
Sold by
Sue Sandra Ah
Bought by
Sue Sandra Ah and The Ah Sue Family Trust
Purchase Details
Closed on
Jun 24, 2013
Sold by
Sue Sandra Ah
Bought by
Sue Sandra Ah and The Ah Sue Family Trust
Purchase Details
Closed on
May 18, 2011
Sold by
Alexander Dean T
Bought by
Ah Sue Sandra Marie
Create a Home Valuation Report for This Property
The Home Valuation Report is an in-depth analysis detailing your home's value as well as a comparison with similar homes in the area
Home Values in the Area
Average Home Value in this Area
Purchase History
| Date | Buyer | Sale Price | Title Company |
|---|---|---|---|
| Gunnell Don Alan | -- | Stewart Title | |
| Sue Sandra Ah | -- | None Available | |
| Sue Sandra Ah | -- | None Available | |
| Sue Sandra Ah | -- | None Available | |
| Ah Sue Sandra Marie | $280,000 | None Available |
Source: Public Records
Mortgage History
| Date | Status | Borrower | Loan Amount |
|---|---|---|---|
| Open | Gunnell Don Alan | $451,600 |
Source: Public Records
Tax History
| Year | Tax Paid | Tax Assessment Tax Assessment Total Assessment is a certain percentage of the fair market value that is determined by local assessors to be the total taxable value of land and additions on the property. | Land | Improvement |
|---|---|---|---|---|
| 2025 | $6,690 | $617,359 | $98,426 | $518,933 |
| 2023 | $6,690 | $593,388 | $94,605 | $498,783 |
| 2022 | $6,538 | $581,753 | $92,750 | $489,003 |
| 2021 | $6,446 | $570,347 | $90,932 | $479,415 |
| 2020 | $1,551 | $131,164 | $35,127 | $96,037 |
| 2019 | $1,523 | $128,593 | $34,439 | $94,154 |
| 2018 | $1,494 | $126,072 | $33,764 | $92,308 |
| 2017 | $1,469 | $123,601 | $33,102 | $90,499 |
| 2016 | $1,378 | $121,178 | $32,453 | $88,725 |
| 2015 | $1,358 | $119,360 | $31,966 | $87,394 |
| 2014 | $1,345 | $117,024 | $31,341 | $85,683 |
Source: Public Records
Map
Nearby Homes
- 2160 Falcon Crest Dr
- 5821 Sunset Ranch Dr
- 5593 Malvern Way
- 2078 Livingston St
- 2130 Old Quarry Rd
- 2188 Ranchwood Place
- 2216 El Capitan Dr
- 6141 Bluffwood Dr
- 2252 El Capitan Dr
- 2111 Elsinore Rd
- 5296 Bronson Way
- 1450 Via Vallarta
- 2424 Central Ave
- 6140 Windemere Way
- 1750 Century Ave
- 6180 Shaker Dr
- 2667 Victoria Park Dr
- 5978 Copperfield Ave
- 5979 Copperfield Ave
- 6146 Hawarden Dr
- 5743 Argyle Way
- 5750 Glenhaven Ct
- 5768 Glenhaven Ct
- 5775 Argyle Way
- 5764 Argyle Way
- 2055 Camden St
- 5738 Glenhaven Ct
- 5782 Glenhaven Ct
- 5731 Argyle Way
- 5738 Argyle Way
- 2030 Wetherly Way
- 2046 Benedict Ave
- 2037 Camden St
- 5790 Argyle Way
- 2029 Wetherly Way
- 5795 Argyle Way
- 5722 Glenhaven Ct Unit 1
- 5717 Argyle Way
- 2040 Camden St
- 2024 Benedict Ave
Your Personal Tour Guide
Ask me questions while you tour the home.