Estimated Value: $399,000 - $463,000
2
Beds
2
Baths
958
Sq Ft
$443/Sq Ft
Est. Value
About This Home
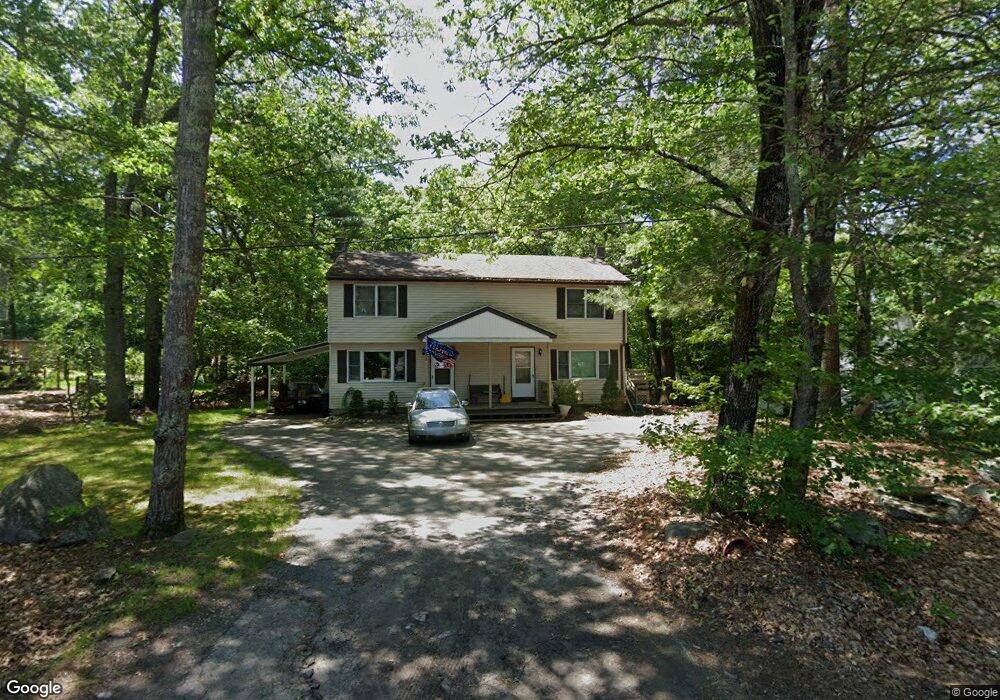
This home is located at 58 Conleys Grove Rd Unit L, Derry, NH 03038 and is currently estimated at $424,330, approximately $442 per square foot. 58 Conleys Grove Rd Unit L is a home located in Rockingham County with nearby schools including East Derry Memorial Elementary School, West Running Brook Middle School, and Pinkerton Academy.
Ownership History
Date
Name
Owned For
Owner Type
Purchase Details
Closed on
Sep 10, 2013
Sold by
Bourque James and Bourque Sharon A
Bought by
Hussey Judy
Current Estimated Value
Purchase Details
Closed on
Mar 28, 2013
Sold by
Deutsche Bank Natl T C
Bought by
Bourque James and Bourque Sharon A
Purchase Details
Closed on
Aug 28, 2012
Sold by
Kennison Everett L
Bought by
Deutsche Bk Natl T Co
Purchase Details
Closed on
May 1, 2002
Sold by
White Stephanie L
Bought by
Kennison Everett L
Home Financials for this Owner
Home Financials are based on the most recent Mortgage that was taken out on this home.
Original Mortgage
$132,100
Interest Rate
7.13%
Create a Home Valuation Report for This Property
The Home Valuation Report is an in-depth analysis detailing your home's value as well as a comparison with similar homes in the area
Home Values in the Area
Average Home Value in this Area
Purchase History
| Date | Buyer | Sale Price | Title Company |
|---|---|---|---|
| Hussey Judy | $118,500 | -- | |
| Hussey Judy | $118,500 | -- | |
| Bourque James | $60,200 | -- | |
| Bourque James | $60,200 | -- | |
| Deutsche Bk Natl T Co | $102,400 | -- | |
| Deutsche Bk Natl T Co | $102,400 | -- | |
| Kennison Everett L | $139,100 | -- | |
| Kennison Everett L | $139,100 | -- |
Source: Public Records
Mortgage History
| Date | Status | Borrower | Loan Amount |
|---|---|---|---|
| Previous Owner | Kennison Everett L | $132,100 | |
| Closed | Kennison Everett L | $0 |
Source: Public Records
Tax History Compared to Growth
Tax History
| Year | Tax Paid | Tax Assessment Tax Assessment Total Assessment is a certain percentage of the fair market value that is determined by local assessors to be the total taxable value of land and additions on the property. | Land | Improvement |
|---|---|---|---|---|
| 2024 | $6,779 | $362,700 | $0 | $362,700 |
| 2023 | $6,392 | $309,100 | $0 | $309,100 |
| 2022 | $5,885 | $309,100 | $0 | $309,100 |
| 2021 | $5,881 | $237,500 | $0 | $237,500 |
| 2020 | $5,781 | $237,500 | $0 | $237,500 |
| 2019 | $5,159 | $197,500 | $110,400 | $87,100 |
| 2018 | $5,184 | $197,500 | $110,400 | $87,100 |
| 2017 | $5,048 | $174,200 | $92,000 | $82,200 |
| 2016 | $4,714 | $174,200 | $92,000 | $82,200 |
| 2015 | $4,045 | $138,400 | $69,000 | $69,400 |
| 2014 | $4,072 | $138,400 | $69,000 | $69,400 |
| 2013 | $4,327 | $137,400 | $68,300 | $69,100 |
Source: Public Records
Map
Nearby Homes
- 67 & 69 Conleys Grove Rd
- 117C Chases Grove Rd
- 120 Chases Grove Rd
- 116 Chases Grove Rd
- 9 Valcat Ln
- Lot 22-50 Valcat Ln
- 114 Chases Grove Rd
- 40 Coles Way
- 21 Coles Way
- 6 Weston St
- 35 Steele Rd
- 20 Chandler Dr
- 160 Mills Shore Dr
- 21 Teague Dr
- 3 Anna Cir
- 62 Veterans Way
- 27 Norwood Rd
- 18 Lorri Rd
- 29 Hawk Dr
- 15 Cambridge Rd
- 58 Conleys Grove Rd Unit A
- 58 Conleys Grove Rd Unit R
- 58A Conleys Grove Rd
- 45 Conleys Grove Rd
- 56 Conleys Grove Rd
- 56 Conleys Grove Rd Unit B
- 56 Conleys Grove Rd Unit A
- 60 Conleys Grove Rd Unit R
- 60 Conleys Grove Rd Unit L
- 60 Conleys Grove Rd Unit 60B
- 60 Conleys Grove Rd
- 47 Conleys Grove Rd
- 18 Waters Edge
- 18 Waters Edge
- 54 Conleys Grove Rd Unit R
- 54 Conleys Grove Rd Unit L
- 54 Conleys Grove Rd
- 54 Conleys Grove Rd Unit B
- 46 Conley's Grove Rd
- 1 Lippold Rd