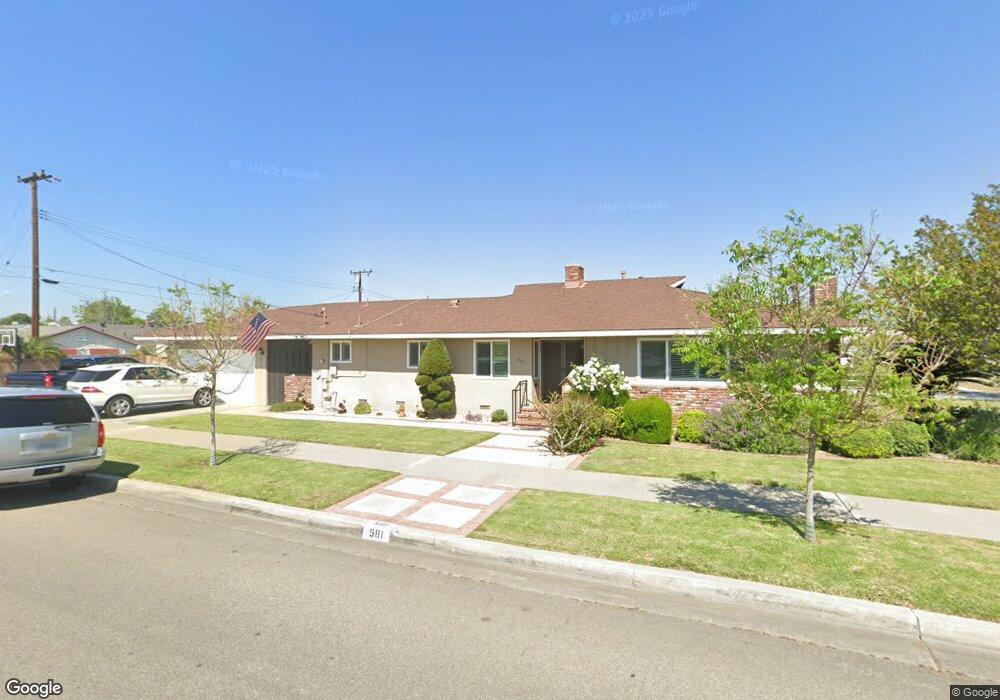
581 N Lincoln St Orange, CA 92867
Estimated Value: $1,100,000 - $1,170,000
3
Beds
3
Baths
1,846
Sq Ft
$613/Sq Ft
Est. Value
About This Home
This home is located at 581 N Lincoln St, Orange, CA 92867 and is currently estimated at $1,132,190, approximately $613 per square foot. 581 N Lincoln St is a home located in Orange County with nearby schools including Cambridge Elementary School, Yorba Middle School, and Orange High School.
Ownership History
Date
Name
Owned For
Owner Type
Purchase Details
Closed on
Mar 22, 2021
Sold by
Venola M Redwine Qualified Personal Resi and Baker Family 2020 Revocable Living Trust
Bought by
Pereira Janet E and Baker Matthew Ross
Current Estimated Value
Purchase Details
Closed on
Dec 30, 2020
Sold by
Ross Baker and Marie Baker Lynda
Bought by
Baker Family 2020 Revocable Living Trust and Baker
Purchase Details
Closed on
Aug 6, 2020
Sold by
Pereira Janet E and Venola M Redwine Qualified Per
Bought by
Pereira Janet E and Blake Kay E
Purchase Details
Closed on
Dec 10, 2007
Sold by
Pereira Janet E and Blake Kay E
Bought by
Pereira Janet E and Blake Kay E
Purchase Details
Closed on
Dec 2, 2004
Sold by
Redwine Venola M
Bought by
Redwine Venola M and Venola M Redwine Qualified Personal Resi
Create a Home Valuation Report for This Property
The Home Valuation Report is an in-depth analysis detailing your home's value as well as a comparison with similar homes in the area
Home Values in the Area
Average Home Value in this Area
Purchase History
We collect this data history from publicly available records. To have your information removed, we recommend requesting removal directly through your county’s website.
| Date | Buyer | Sale Price | Title Company |
|---|---|---|---|
| Pereira Janet E | -- | None Listed On Document | |
| Baker Family 2020 Revocable Living Trust | -- | None Listed On Document | |
| Pereira Janet E | -- | Lawyers Title | |
| Pereira Janet E | -- | None Available | |
| Pereira Janet E | -- | None Available | |
| Redwine Venola M | -- | -- | |
| Redwine Venola M | -- | -- |
Source: Public Records
Tax History
| Year | Tax Paid | Tax Assessment Tax Assessment Total Assessment is a certain percentage of the fair market value that is determined by local assessors to be the total taxable value of land and additions on the property. | Land | Improvement |
|---|---|---|---|---|
| 2025 | $1,422 | $106,489 | $27,072 | $79,417 |
| 2024 | $1,422 | $104,401 | $26,541 | $77,860 |
| 2023 | $1,385 | $102,354 | $26,020 | $76,334 |
| 2022 | $1,353 | $100,348 | $25,510 | $74,838 |
| 2021 | $1,392 | $98,381 | $25,010 | $73,371 |
| 2020 | $1,306 | $97,373 | $24,754 | $72,619 |
| 2019 | $1,292 | $95,464 | $24,268 | $71,196 |
| 2018 | $1,272 | $93,593 | $23,793 | $69,800 |
| 2017 | $1,226 | $91,758 | $23,326 | $68,432 |
| 2016 | $1,203 | $89,959 | $22,868 | $67,091 |
| 2015 | $1,184 | $88,608 | $22,524 | $66,084 |
| 2014 | $1,158 | $86,873 | $22,083 | $64,790 |
Source: Public Records
Map
Nearby Homes
- 1306 E Rose Ave
- 1224 E Orange Grove Ave
- 774 N Victoria Dr
- 365 N Magnolia St
- 934 E Rose Ave
- 1514 E Palm Ave
- 552 N Cambridge St
- 1944 E Lomita Ave
- 1801 E Collins Ave Unit 42
- 178 N Monterey Rd
- 390 N Milford Rd
- 914 N Sacramento St
- 262 N Cambridge St
- 815 E Collins Ave
- 1314 E Chapman Ave
- 741 N Handy St
- 909 N Cleveland St
- 608 E Collins Ave
- 918 N Cleveland St
- 2705 E Orange Grove Ave
- 1511 E Orange Grove Ave
- 1513 E Orange Grove Ave
- 1517 E Orange Grove Ave
- 1506 E Rose Ave
- 584 N Lincoln St
- 1439 E Orange Grove Ave
- 1512 E Rose Ave
- 1523 E Orange Grove Ave
- 1518 E Rose Ave
- 1430 E Orange Grove Ave
- 1429 E Orange Grove Ave
- 1506 E Orange Grove Ave
- 1512 E Orange Grove Ave
- 1524 E Rose Ave
- 1439 E Madison Ave
- 1440 E Rose Ave
- 1518 E Orange Grove Ave
- 1420 E Orange Grove Ave
- 1419 E Orange Grove Ave
- 1529 E Orange Grove Ave
Your Personal Tour Guide
Ask me questions while you tour the home.