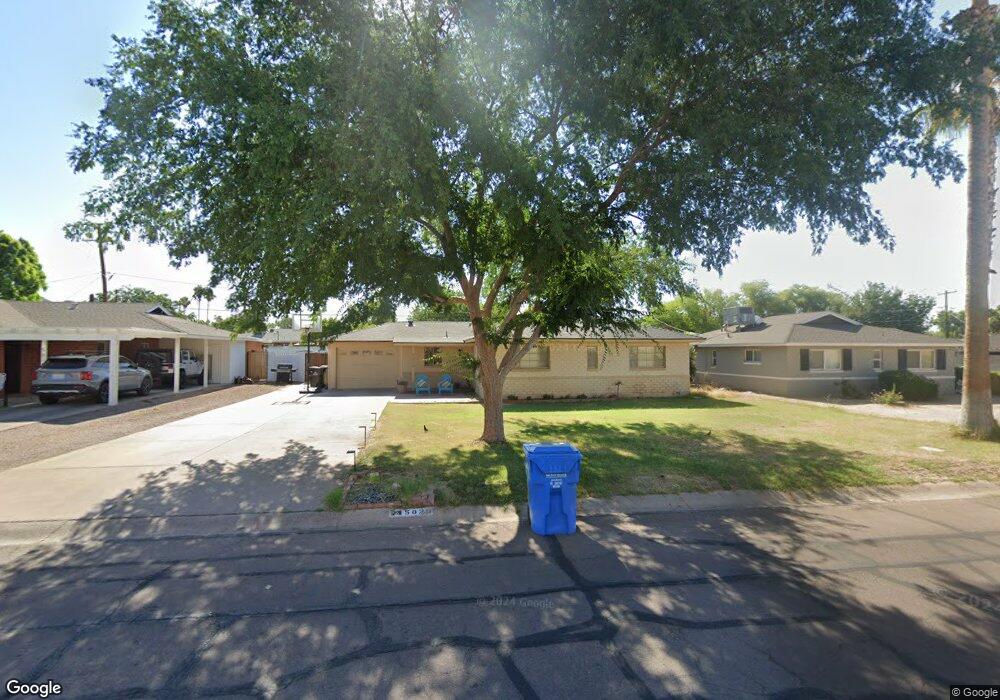
5829 N 18th St Phoenix, AZ 85016
Camelback East Village NeighborhoodEstimated Value: $627,299 - $736,000
3
Beds
2
Baths
1,583
Sq Ft
$440/Sq Ft
Est. Value
About This Home
This home is located at 5829 N 18th St, Phoenix, AZ 85016 and is currently estimated at $697,075, approximately $440 per square foot. 5829 N 18th St is a home located in Maricopa County with nearby schools including Madison Rose Lane Elementary School, Madison No. 1 Middle School, and Phoenix Coding Academy.
Ownership History
Date
Name
Owned For
Owner Type
Purchase Details
Closed on
Aug 3, 2016
Sold by
Mattingly Warren and Mattingly Paula
Bought by
Gonzalez Cesar and Gonzalez Roseanne C
Current Estimated Value
Home Financials for this Owner
Home Financials are based on the most recent Mortgage that was taken out on this home.
Original Mortgage
$274,928
Interest Rate
4.4%
Mortgage Type
FHA
Purchase Details
Closed on
May 22, 2006
Sold by
Polton Stacey and Stover Stacey Ann
Bought by
Mattingly Warren and Mattingly Paula
Purchase Details
Closed on
Sep 6, 1995
Sold by
Polton Steve
Bought by
Polton Stacey Ann
Home Financials for this Owner
Home Financials are based on the most recent Mortgage that was taken out on this home.
Original Mortgage
$10,000
Interest Rate
7.83%
Create a Home Valuation Report for This Property
The Home Valuation Report is an in-depth analysis detailing your home's value as well as a comparison with similar homes in the area
Home Values in the Area
Average Home Value in this Area
Purchase History
| Date | Buyer | Sale Price | Title Company |
|---|---|---|---|
| Gonzalez Cesar | $280,000 | Pioneer Title Agency Inc | |
| Mattingly Warren | $305,000 | First American Title Ins Co | |
| Polton Stacey Ann | -- | Fiesta Title & Escrow Agency |
Source: Public Records
Mortgage History
| Date | Status | Borrower | Loan Amount |
|---|---|---|---|
| Open | Gonzalez Cesar | $266,602 | |
| Closed | Gonzalez Cesar | $274,928 | |
| Previous Owner | Polton Stacey A | $50,000 | |
| Previous Owner | Polton Stacey Ann | $10,000 | |
| Previous Owner | Stover Stacey A | $81,950 |
Source: Public Records
Tax History Compared to Growth
Tax History
| Year | Tax Paid | Tax Assessment Tax Assessment Total Assessment is a certain percentage of the fair market value that is determined by local assessors to be the total taxable value of land and additions on the property. | Land | Improvement |
|---|---|---|---|---|
| 2025 | $3,114 | $28,563 | -- | -- |
| 2024 | $3,024 | $27,203 | -- | -- |
| 2023 | $3,024 | $41,610 | $8,320 | $33,290 |
| 2022 | $2,927 | $31,280 | $6,250 | $25,030 |
| 2021 | $2,986 | $30,480 | $6,090 | $24,390 |
| 2020 | $2,938 | $26,880 | $5,370 | $21,510 |
| 2019 | $2,871 | $26,450 | $5,290 | $21,160 |
| 2018 | $2,796 | $22,080 | $4,410 | $17,670 |
| 2017 | $2,654 | $23,420 | $4,680 | $18,740 |
| 2016 | $3,250 | $22,550 | $4,510 | $18,040 |
| 2015 | $2,380 | $21,160 | $4,230 | $16,930 |
Source: Public Records
Map
Nearby Homes
- 1909 E Bethany Home Rd
- 1708 E Solano Dr
- 1704 E Solano Dr
- 1651 E Rovey Ave
- 1712 E Montebello Ave
- 1801 E Montebello Ave
- 1940 E Bethany Home Rd Unit 87
- 1939 E Solano Dr
- 1808 E Luke Ave
- 5709 N 16th St
- 1745 E San Juan Ave
- 2108 E Solano Dr
- 1914 E Missouri Ave Unit 2
- 5550 N 16th St Unit 113
- 1901 E Missouri Ave Unit 219
- 1901 E Missouri Ave Unit 208
- 1901 E Missouri Ave Unit 216
- 1711 E Missouri Ave Unit 8
- 6314 N 19th St
- 5502 Plan at Viridian
- 5823 N 18th St
- 5835 N 18th St
- 5824 N 18th Place
- 5817 N 18th St
- 5828 N 18th Place
- 5818 N 18th Place
- 1801 E Bethany Home Rd
- 1809 E Bethany Home Rd
- 5811 N 18th St
- 1811 E Bethany Home Rd
- 1820 E Palo Verde Dr
- 5802 N 18th Place
- 1821 E Palo Verde Dr
- 1821 E Bethany Home Rd
- 5815 N 18th Place
- 5801 N 18th St
- 1802 E Bethany Home Rd
- 5754 N 18th Place
- 1808 E Bethany Home Rd
- 41800 N 18th St Unit 7