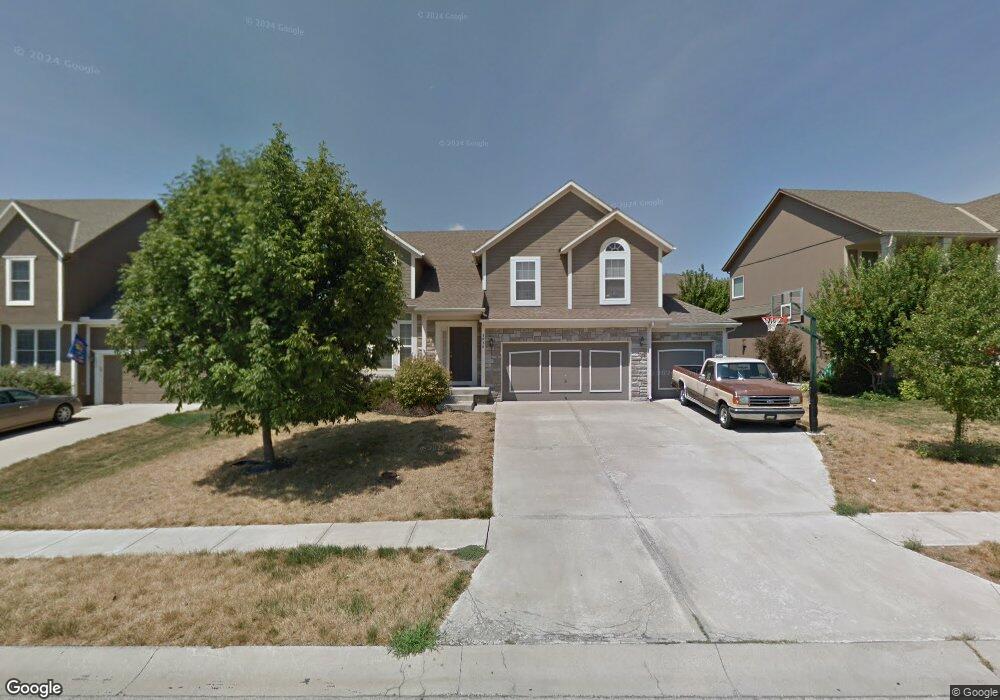
5834 Woodstock St Shawnee, KS 66218
Estimated Value: $448,000 - $470,000
4
Beds
3
Baths
1,663
Sq Ft
$278/Sq Ft
Est. Value
About This Home
This home is located at 5834 Woodstock St, Shawnee, KS 66218 and is currently estimated at $461,791, approximately $277 per square foot. 5834 Woodstock St is a home located in Johnson County with nearby schools including Clear Creek Elementary School, Monticello Trails Middle School, and Mill Valley High School.
Ownership History
Date
Name
Owned For
Owner Type
Purchase Details
Closed on
Jun 15, 2009
Sold by
Watkins Clay E and Watkins Mary
Bought by
Ferguson Jason E and Ferguson Jennifer L
Current Estimated Value
Home Financials for this Owner
Home Financials are based on the most recent Mortgage that was taken out on this home.
Original Mortgage
$235,653
Outstanding Balance
$149,370
Interest Rate
4.83%
Mortgage Type
FHA
Estimated Equity
$312,421
Purchase Details
Closed on
Mar 30, 2004
Sold by
Heartland Investments Llc
Bought by
Watkins Clay E and Watkins Mary
Home Financials for this Owner
Home Financials are based on the most recent Mortgage that was taken out on this home.
Original Mortgage
$185,560
Interest Rate
5.59%
Mortgage Type
Purchase Money Mortgage
Purchase Details
Closed on
May 6, 2003
Sold by
Lakepoint Developers Inc
Bought by
Heartland Investments Llc
Create a Home Valuation Report for This Property
The Home Valuation Report is an in-depth analysis detailing your home's value as well as a comparison with similar homes in the area
Home Values in the Area
Average Home Value in this Area
Purchase History
| Date | Buyer | Sale Price | Title Company |
|---|---|---|---|
| Ferguson Jason E | -- | First American Title Ins Co | |
| Watkins Clay E | -- | Security Land Title Company | |
| Heartland Investments Llc | -- | Security Land Title Company |
Source: Public Records
Mortgage History
| Date | Status | Borrower | Loan Amount |
|---|---|---|---|
| Open | Ferguson Jason E | $235,653 | |
| Previous Owner | Watkins Clay E | $185,560 | |
| Closed | Watkins Clay E | $34,792 |
Source: Public Records
Tax History Compared to Growth
Tax History
| Year | Tax Paid | Tax Assessment Tax Assessment Total Assessment is a certain percentage of the fair market value that is determined by local assessors to be the total taxable value of land and additions on the property. | Land | Improvement |
|---|---|---|---|---|
| 2024 | $5,953 | $51,140 | $10,711 | $40,429 |
| 2023 | $5,554 | $47,230 | $10,711 | $36,519 |
| 2022 | $5,216 | $43,459 | $9,314 | $34,145 |
| 2021 | $4,843 | $38,790 | $8,461 | $30,329 |
| 2020 | $4,523 | $35,892 | $8,461 | $27,431 |
| 2019 | $4,372 | $34,178 | $6,414 | $27,764 |
| 2018 | $4,131 | $32,005 | $6,414 | $25,591 |
| 2017 | $4,113 | $31,085 | $5,825 | $25,260 |
| 2016 | $3,980 | $29,705 | $5,549 | $24,156 |
| 2015 | $3,959 | $29,061 | $5,549 | $23,512 |
| 2013 | -- | $26,301 | $5,549 | $20,752 |
Source: Public Records
Map
Nearby Homes
- 5817 Millbrook St
- 5900 Redbud St
- 5725 Marion St
- 6046 Redbud St
- 6031 Lakecrest Dr
- 21309 W 56th St
- 21315 W 56th St
- 21217 W 55th Terrace
- 6246 Woodland Dr
- 21609 W 61st St
- 5405 Lakecrest Dr
- 58.14 acres Woodland Dr
- 31.24 Acres of Woodland Dr
- 46.13 Acres of Woodland Dr
- 5311 Brownridge Dr
- 5307 Noble St
- 21624 W 53rd Terrace
- 22209 W 57th St
- 7943 Noble St
- 7939 Noble St
- 5830 Woodstock St
- 5838 Woodstock St
- 5829 Longview Rd
- 5826 Woodstock St
- 5825 Longview Rd
- 5857 Millbrook St
- 5829 Woodstock St
- 5822 Woodstock St
- 5821 Longview Rd
- 5825 Woodstock St
- 5853 Millbrook St
- 5901 Longview St
- 5817 Longview Rd
- 5818 Woodstock St
- 5821 Woodstock St
- 5906 Woodstock St
- 5844 Millbrook St
- 5849 Millbrook St
- 5906 Theden St
- 5905 Longview St