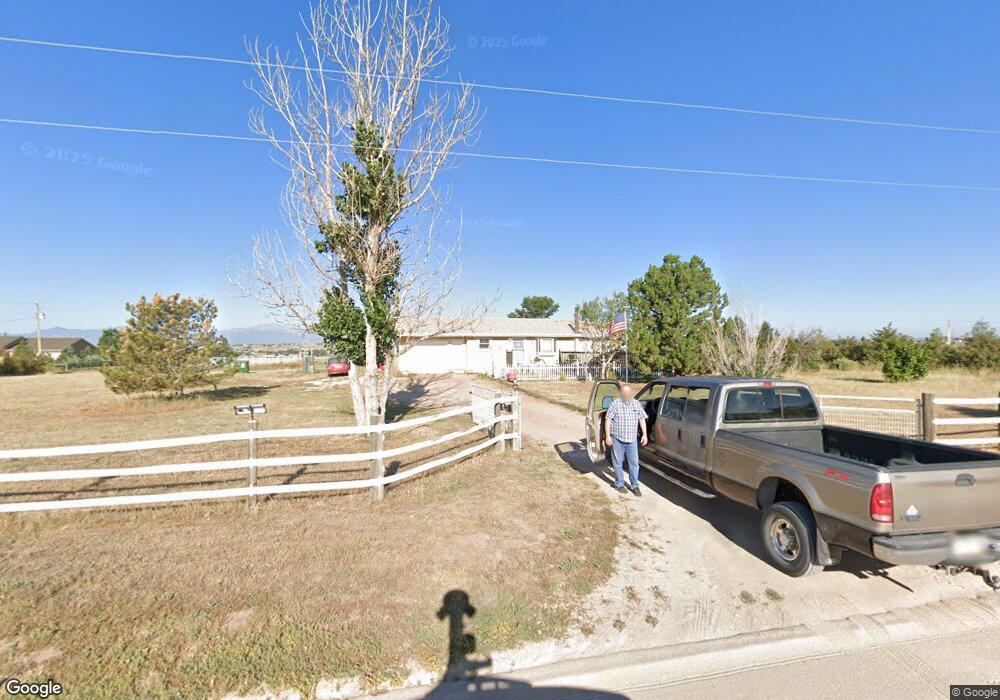
5930 Good Fortune Rd Peyton, CO 80831
Falcon NeighborhoodEstimated Value: $446,000 - $516,000
2
Beds
2
Baths
972
Sq Ft
$495/Sq Ft
Est. Value
About This Home
This home is located at 5930 Good Fortune Rd, Peyton, CO 80831 and is currently estimated at $481,041, approximately $494 per square foot. 5930 Good Fortune Rd is a home located in El Paso County with nearby schools including Falcon Elementary School Of Technology, Clifford Street Elementary School, and City Terrace Elementary School.
Ownership History
Date
Name
Owned For
Owner Type
Purchase Details
Closed on
Aug 18, 1995
Sold by
Landy Leann M H
Bought by
Mabbitt Michael B and Mabbitt Kenette C C
Current Estimated Value
Home Financials for this Owner
Home Financials are based on the most recent Mortgage that was taken out on this home.
Original Mortgage
$112,785
Interest Rate
8.5%
Mortgage Type
VA
Purchase Details
Closed on
Oct 28, 1994
Sold by
Landy Craig S
Bought by
Landy Leann M
Purchase Details
Closed on
Mar 1, 1989
Bought by
Mabbitt Michael B and Mabbitt Kenette C
Purchase Details
Closed on
Oct 1, 1988
Bought by
Mabbitt Michael B and Mabbitt Kenette C
Purchase Details
Closed on
Aug 6, 1987
Bought by
Mabbitt Michael B and Mabbitt Kenette C
Purchase Details
Closed on
Nov 1, 1983
Bought by
Mabbitt Michael B and Mabbitt Kenette C
Create a Home Valuation Report for This Property
The Home Valuation Report is an in-depth analysis detailing your home's value as well as a comparison with similar homes in the area
Home Values in the Area
Average Home Value in this Area
Purchase History
| Date | Buyer | Sale Price | Title Company |
|---|---|---|---|
| Mabbitt Michael B | -- | -- | |
| Landy Leann M | -- | -- | |
| Mabbitt Michael B | -- | -- | |
| Mabbitt Michael B | -- | -- | |
| Mabbitt Michael B | -- | -- | |
| Mabbitt Michael B | -- | -- |
Source: Public Records
Mortgage History
| Date | Status | Borrower | Loan Amount |
|---|---|---|---|
| Closed | Mabbitt Michael B | $112,785 |
Source: Public Records
Tax History Compared to Growth
Tax History
| Year | Tax Paid | Tax Assessment Tax Assessment Total Assessment is a certain percentage of the fair market value that is determined by local assessors to be the total taxable value of land and additions on the property. | Land | Improvement |
|---|---|---|---|---|
| 2025 | $2,004 | $32,290 | -- | -- |
| 2024 | $1,896 | $32,020 | $8,720 | $23,300 |
| 2023 | $1,896 | $32,020 | $8,720 | $23,300 |
| 2022 | $1,139 | $16,400 | $6,720 | $9,680 |
| 2021 | $1,185 | $16,880 | $6,920 | $9,960 |
| 2020 | $1,024 | $14,520 | $5,400 | $9,120 |
| 2019 | $1,014 | $14,520 | $5,400 | $9,120 |
| 2018 | $827 | $11,640 | $4,900 | $6,740 |
| 2017 | $758 | $11,640 | $4,900 | $6,740 |
| 2016 | $704 | $10,670 | $5,180 | $5,490 |
| 2015 | $705 | $10,670 | $5,180 | $5,490 |
| 2014 | $671 | $9,970 | $4,780 | $5,190 |
Source: Public Records
Map
Nearby Homes
- 6545 Connie Lee Ct
- 6010 Curtis Rd
- 5705 John Ross Ct
- 5865 E Blaney Rd
- 7335 Chelsey Way
- 15125 Ewing Ct
- 13260 Cottontail Dr
- 5915 W Condor Rd
- 12565 Richardson Ln
- 14407 Jones Rd
- 14891 Oscuro Trail
- 5664 Southfork Dr
- 14961 Oscuro Trail
- 7464 Truchas Trail
- 15101 Oscuro Trail
- Summit Plan at Saddlehorn Ranch
- Dolores Peak Plan at Saddlehorn Ranch
- Durango Plan at Saddlehorn Ranch
- Haven Plan at Saddlehorn Ranch
- Monarch Plan at Saddlehorn Ranch
- 5980 Good Fortune Rd
- 5870 Good Fortune Rd
- 5865 Good Fortune Rd
- 5925 Good Fortune Rd
- 6020 Good Fortune Rd
- 5810 Good Fortune Rd
- 6015 Good Fortune Rd
- 5805 Good Fortune Rd
- 6070 Good Fortune Rd
- 5755 Good Fortune Rd
- 13685 Sunny Slope Rd
- 6065 Good Fortune Rd
- 5990 Renneberger Rd
- 5920 Renneberger Rd
- 5710 Good Fortune Rd
- 6130 Good Fortune Rd
- 6025 Carriage Dr
- 5705 Good Fortune Rd
- 6075 Carriage Dr
- 6125 Good Fortune Rd