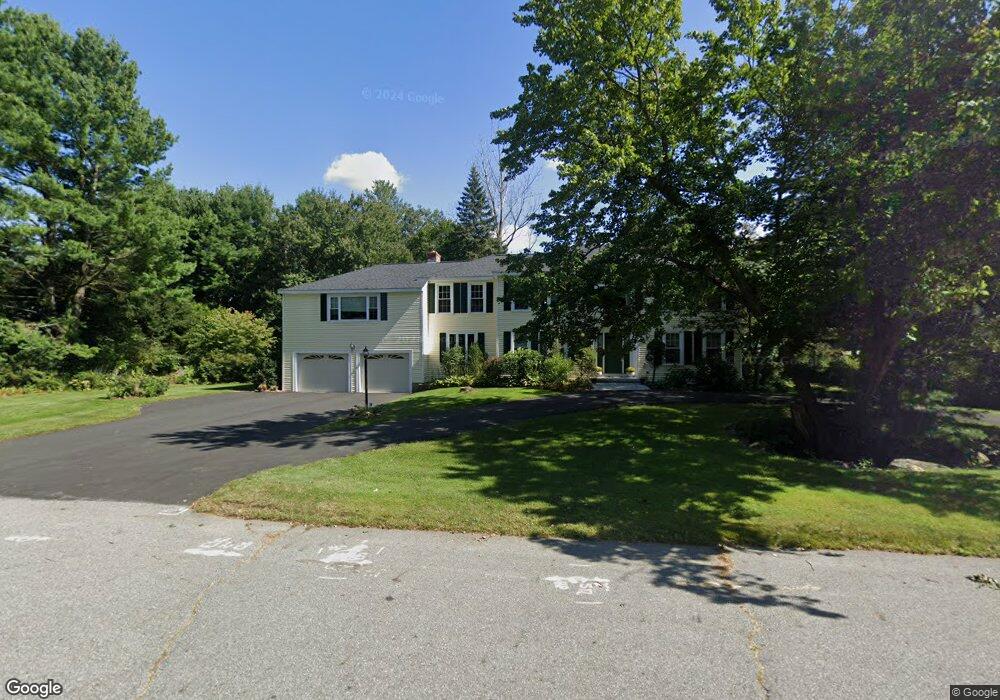
6 Penacook Place Andover, MA 01810
West Andover NeighborhoodEstimated Value: $1,598,251 - $1,943,000
4
Beds
4
Baths
4,476
Sq Ft
$393/Sq Ft
Est. Value
About This Home
This home is located at 6 Penacook Place, Andover, MA 01810 and is currently estimated at $1,758,313, approximately $392 per square foot. 6 Penacook Place is a home located in Essex County with nearby schools including West Elementary School, Andover West Middle School, and Andover High School.
Ownership History
Date
Name
Owned For
Owner Type
Purchase Details
Closed on
Aug 25, 2020
Sold by
Freedman Alan M and Freedman Deborah A
Bought by
Deborah Anne Freedman T
Current Estimated Value
Purchase Details
Closed on
May 6, 2011
Sold by
6 Penacook Place Rt and Freedman Alan M
Bought by
Freedman Alan M and Freedman Deborah A
Home Financials for this Owner
Home Financials are based on the most recent Mortgage that was taken out on this home.
Original Mortgage
$280,000
Interest Rate
3%
Mortgage Type
Purchase Money Mortgage
Purchase Details
Closed on
Jul 31, 1992
Sold by
Ackerman Edward S
Bought by
Freedman Alan M
Create a Home Valuation Report for This Property
The Home Valuation Report is an in-depth analysis detailing your home's value as well as a comparison with similar homes in the area
Home Values in the Area
Average Home Value in this Area
Purchase History
| Date | Buyer | Sale Price | Title Company |
|---|---|---|---|
| Deborah Anne Freedman T | -- | None Available | |
| Freedman Alan M | -- | -- | |
| Freedman Alan M | $370,000 | -- |
Source: Public Records
Mortgage History
| Date | Status | Borrower | Loan Amount |
|---|---|---|---|
| Previous Owner | Freedman Alan M | $280,000 | |
| Previous Owner | Freedman Alan M | $300,000 | |
| Previous Owner | Freedman Alan M | $500,000 | |
| Previous Owner | Freedman Alan M | $294,500 |
Source: Public Records
Tax History Compared to Growth
Tax History
| Year | Tax Paid | Tax Assessment Tax Assessment Total Assessment is a certain percentage of the fair market value that is determined by local assessors to be the total taxable value of land and additions on the property. | Land | Improvement |
|---|---|---|---|---|
| 2024 | $18,475 | $1,434,400 | $629,600 | $804,800 |
| 2023 | $17,728 | $1,297,800 | $567,100 | $730,700 |
| 2022 | $16,736 | $1,146,300 | $493,100 | $653,200 |
| 2021 | $16,070 | $1,051,000 | $448,200 | $602,800 |
| 2020 | $15,465 | $1,030,300 | $437,100 | $593,200 |
| 2019 | $15,386 | $1,007,600 | $424,500 | $583,100 |
| 2018 | $14,819 | $947,500 | $408,100 | $539,400 |
| 2017 | $14,237 | $937,900 | $400,000 | $537,900 |
| 2016 | $13,949 | $941,200 | $400,000 | $541,200 |
| 2015 | $13,431 | $897,200 | $384,400 | $512,800 |
Source: Public Records
Map
Nearby Homes
- 18 Bryan Ln Unit 18
- 105 Central St
- 103 Central St
- 4 Hazelwood Cir
- 47 Abbot St
- 18 Dale St Unit 4G
- 31 Porter Rd
- 3 West Hollow
- 4 Hammond Way
- 25 Timothy Dr
- 37 Crenshaw Ln Unit 37
- Lot 7 Weeping Willow Dr
- 9 Chapman Ave
- 42 Stevens St
- 38 Lincoln Cir E
- 2 Powder Mill Square Unit 2B
- 50 Hidden Rd
- 56 Sunset Rock Rd
- 10 Maple Ave Unit 3
- 61 Elm St Unit 61