4
Beds
1
Bath
4,000
Sq Ft
23,087
Sq Ft Lot
About This Home
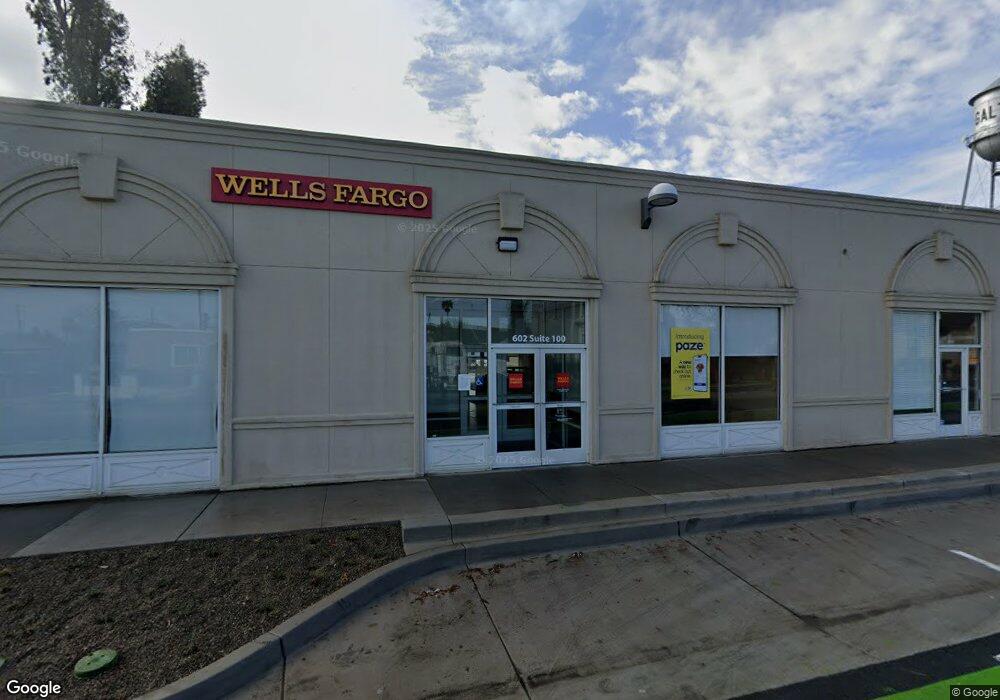
This home is located at 602 C St, Galt, CA 95632. 602 C St is a home located in Sacramento County with nearby schools including River Oaks Elementary School, Robert L. McCaffrey Middle School, and Galt High School.
Ownership History
Date
Name
Owned For
Owner Type
Purchase Details
Closed on
Feb 24, 2004
Sold by
Faszer Annette K
Bought by
Faszer Annette K
Purchase Details
Closed on
Jan 2, 1998
Sold by
Faszer Charles J and Faszer Annette K
Bought by
Faszer Charles J and Faszer Annette K
Purchase Details
Closed on
Jun 26, 1997
Sold by
Leal Delores
Bought by
Faszer Charles J and Faszer Annette K
Purchase Details
Closed on
Jun 14, 1994
Sold by
Mcallister Martin and Mcallister Cleo
Bought by
Leal Delores
Home Financials for this Owner
Home Financials are based on the most recent Mortgage that was taken out on this home.
Original Mortgage
$50,000
Interest Rate
8.83%
Create a Home Valuation Report for This Property
The Home Valuation Report is an in-depth analysis detailing your home's value as well as a comparison with similar homes in the area
Home Values in the Area
Average Home Value in this Area
Purchase History
| Date | Buyer | Sale Price | Title Company |
|---|---|---|---|
| Faszer Annette K | -- | -- | |
| Faszer Charles J | -- | -- | |
| Faszer Charles J | $135,000 | Old Republic Title Company | |
| Leal Delores | $75,000 | -- |
Source: Public Records
Mortgage History
| Date | Status | Borrower | Loan Amount |
|---|---|---|---|
| Previous Owner | Leal Delores | $50,000 |
Source: Public Records
Tax History
| Year | Tax Paid | Tax Assessment Tax Assessment Total Assessment is a certain percentage of the fair market value that is determined by local assessors to be the total taxable value of land and additions on the property. | Land | Improvement |
|---|---|---|---|---|
| 2025 | $18,363 | $1,668,617 | $215,550 | $1,453,067 |
| 2024 | $18,363 | $1,635,900 | $211,324 | $1,424,576 |
| 2023 | $18,054 | $1,603,825 | $207,181 | $1,396,644 |
| 2022 | $17,326 | $1,572,378 | $203,119 | $1,369,259 |
| 2021 | $17,347 | $1,541,548 | $199,137 | $1,342,411 |
| 2020 | $17,201 | $1,525,743 | $197,096 | $1,328,647 |
| 2019 | $16,776 | $1,495,828 | $193,232 | $1,302,596 |
| 2018 | $16,750 | $1,466,499 | $189,444 | $1,277,055 |
| 2017 | $16,093 | $1,437,745 | $185,730 | $1,252,015 |
| 2016 | $15,463 | $1,409,555 | $182,089 | $1,227,466 |
| 2015 | $14,931 | $1,388,383 | $179,354 | $1,209,029 |
| 2014 | $14,893 | $1,361,187 | $175,841 | $1,185,346 |
Source: Public Records
Map
Nearby Homes
- 433 5th St
- 133 5th St
- 461 F St
- 240 3rd St
- 219 Lois Ave
- 150 Spruce Ave
- 712 Church St
- 0 B St Unit 226013319
- 246 Oak Ave
- 700 2nd St Unit 40
- 700 2nd St Unit 14
- 881 Spur Way
- 702 Elm Ave
- 667 Germaine Dr
- 105 Kent St
- 104 Wildflower Dr
- 1095 Honeysuckle Hill Ave
- 1087 Honeysuckle Hill Ave
- 1099 Honeysuckle Hill Ave
- 1046 Redwood Glen Ave
Your Personal Tour Guide
Ask me questions while you tour the home.