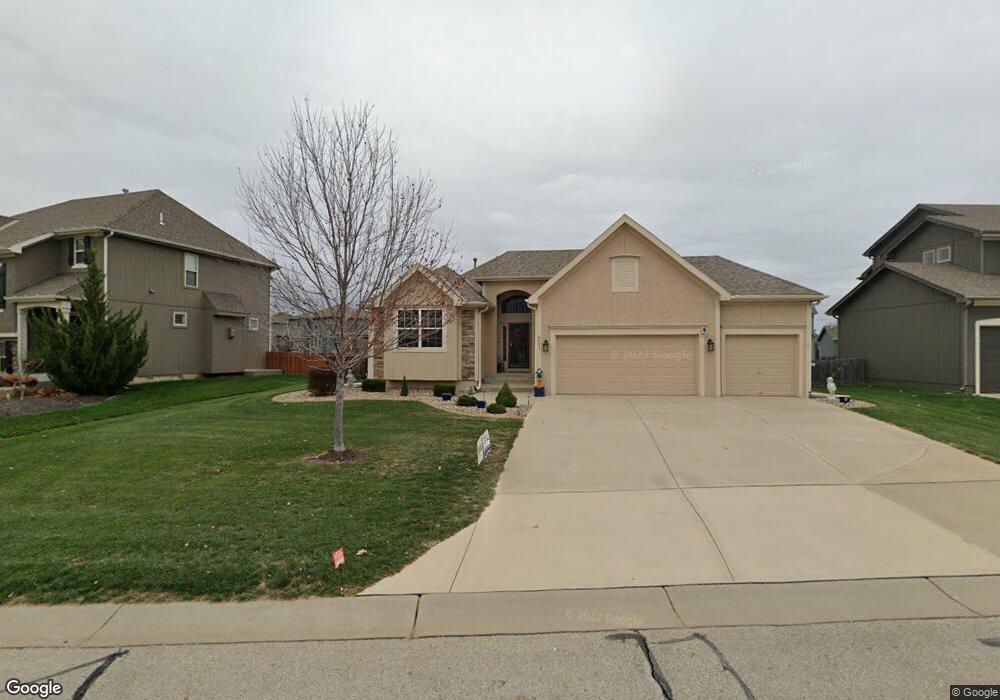
6021 Marion St Shawnee, KS 66218
Estimated Value: $519,000 - $538,000
4
Beds
3
Baths
1,723
Sq Ft
$308/Sq Ft
Est. Value
About This Home
This home is located at 6021 Marion St, Shawnee, KS 66218 and is currently estimated at $530,307, approximately $307 per square foot. 6021 Marion St is a home located in Johnson County with nearby schools including Horizon Elementary School, Monticello Trails Middle School, and Mill Valley High School.
Ownership History
Date
Name
Owned For
Owner Type
Purchase Details
Closed on
Oct 4, 2023
Sold by
Meek Family Wealth Trust
Bought by
Bacon Walter R and Gillespie Beth M
Current Estimated Value
Purchase Details
Closed on
Mar 30, 2015
Sold by
Meek Frederick C and Meek Patsy R
Bought by
Meek Family Wealth Trust and Meek Patsy Ruth
Purchase Details
Closed on
Sep 19, 2014
Sold by
Meek Frederick C and Meek Patsy R
Bought by
Meek Frederick Clark and Meek Patsy Ruth
Purchase Details
Closed on
Jan 27, 2010
Sold by
Chris George Homes Inc
Bought by
Meek Frederick C and Meek Patsy R
Purchase Details
Closed on
Oct 30, 2009
Sold by
95Th Street Service Corp
Bought by
Chris George Homes Inc
Purchase Details
Closed on
May 21, 2009
Sold by
Hfc Investments Llc
Bought by
95Th Street Service Corp
Create a Home Valuation Report for This Property
The Home Valuation Report is an in-depth analysis detailing your home's value as well as a comparison with similar homes in the area
Home Values in the Area
Average Home Value in this Area
Purchase History
| Date | Buyer | Sale Price | Title Company |
|---|---|---|---|
| Bacon Walter R | -- | None Listed On Document | |
| Meek Family Wealth Trust | -- | None Available | |
| Meek Frederick Clark | -- | None Available | |
| Meek Frederick C | -- | First American Title Ins Co | |
| Chris George Homes Inc | -- | Heartland Title Company Inc | |
| 95Th Street Service Corp | -- | None Available |
Source: Public Records
Tax History Compared to Growth
Tax History
| Year | Tax Paid | Tax Assessment Tax Assessment Total Assessment is a certain percentage of the fair market value that is determined by local assessors to be the total taxable value of land and additions on the property. | Land | Improvement |
|---|---|---|---|---|
| 2024 | $6,735 | $57,753 | $11,824 | $45,929 |
| 2023 | $6,380 | $54,222 | $11,824 | $42,398 |
| 2022 | $5,846 | $48,691 | $10,282 | $38,409 |
| 2021 | $5,384 | $43,148 | $9,346 | $33,802 |
| 2020 | $5,166 | $41,020 | $9,346 | $31,674 |
| 2019 | $5,180 | $40,538 | $8,487 | $32,051 |
| 2018 | $5,027 | $38,985 | $8,487 | $30,498 |
| 2017 | $5,006 | $37,881 | $7,706 | $30,175 |
| 2016 | $5,040 | $37,674 | $6,443 | $31,231 |
| 2015 | $4,919 | $36,087 | $5,522 | $30,565 |
| 2013 | -- | $33,016 | $5,522 | $27,494 |
Source: Public Records
Map
Nearby Homes
- 6031 Lakecrest Dr
- 6046 Redbud St
- 5900 Redbud St
- 21609 W 61st St
- 5725 Marion St
- 5817 Millbrook St
- 6246 Woodland Dr
- 21309 W 56th St
- 21315 W 56th St
- 21217 W 55th Terrace
- 58.14 acres Woodland Dr
- 31.24 Acres of Woodland Dr
- 46.13 Acres of Woodland Dr
- 7943 Noble St
- 7939 Noble St
- 5405 Lakecrest Dr
- 22209 W 57th St
- 6358 Hilltop St
- 5311 Brownridge Dr
- 22310 W 58th St