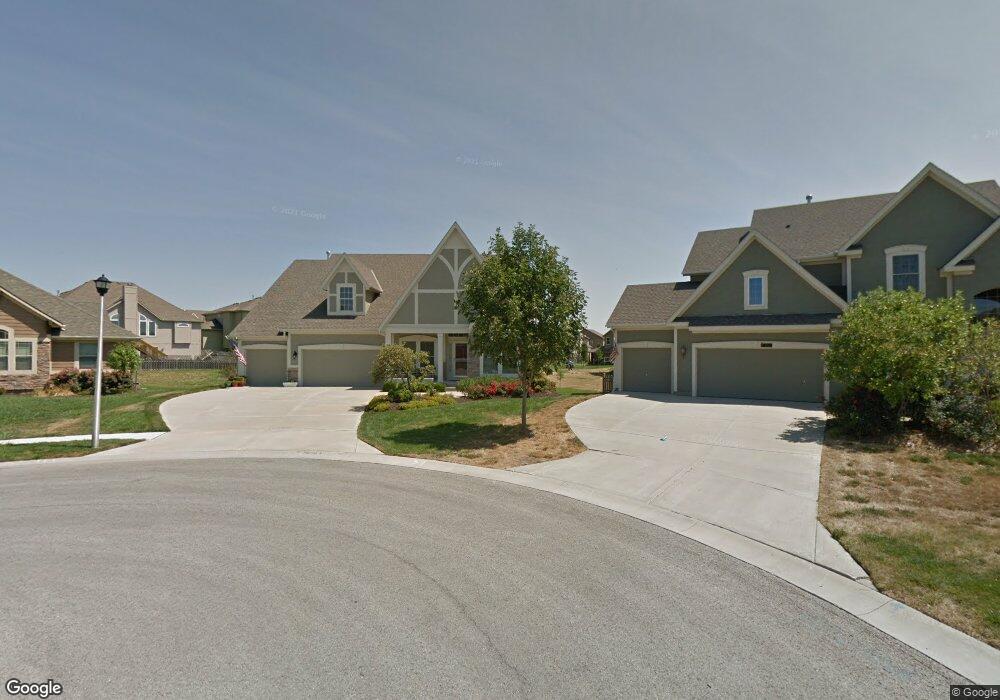
6039 Theden St Shawnee, KS 66218
Estimated Value: $531,000 - $625,000
3
Beds
3
Baths
2,528
Sq Ft
$228/Sq Ft
Est. Value
About This Home
This home is located at 6039 Theden St, Shawnee, KS 66218 and is currently estimated at $576,904, approximately $228 per square foot. 6039 Theden St is a home located in Johnson County with nearby schools including Horizon Elementary School, Monticello Trails Middle School, and Mill Valley High School.
Ownership History
Date
Name
Owned For
Owner Type
Purchase Details
Closed on
Mar 24, 2006
Sold by
Duggan Homes Inc
Bought by
Lammers Glen R and Lammers Patricia A
Current Estimated Value
Home Financials for this Owner
Home Financials are based on the most recent Mortgage that was taken out on this home.
Original Mortgage
$245,000
Outstanding Balance
$138,007
Interest Rate
6.21%
Mortgage Type
New Conventional
Estimated Equity
$438,897
Purchase Details
Closed on
Oct 10, 2005
Sold by
Hfc Investments Llc
Bought by
Duggan Homes Inc
Home Financials for this Owner
Home Financials are based on the most recent Mortgage that was taken out on this home.
Original Mortgage
$329,318
Interest Rate
5.69%
Mortgage Type
Future Advance Clause Open End Mortgage
Purchase Details
Closed on
Sep 6, 2005
Sold by
Duggan Homes Inc
Bought by
Hfc Investments Llc
Home Financials for this Owner
Home Financials are based on the most recent Mortgage that was taken out on this home.
Original Mortgage
$329,318
Interest Rate
5.69%
Mortgage Type
Future Advance Clause Open End Mortgage
Create a Home Valuation Report for This Property
The Home Valuation Report is an in-depth analysis detailing your home's value as well as a comparison with similar homes in the area
Home Values in the Area
Average Home Value in this Area
Purchase History
| Date | Buyer | Sale Price | Title Company |
|---|---|---|---|
| Lammers Glen R | -- | Chicago Title Ins Co | |
| Duggan Homes Inc | -- | Chicago Title Insurnce Co | |
| Hfc Investments Llc | -- | None Available |
Source: Public Records
Mortgage History
| Date | Status | Borrower | Loan Amount |
|---|---|---|---|
| Open | Lammers Glen R | $245,000 | |
| Previous Owner | Duggan Homes Inc | $329,318 |
Source: Public Records
Tax History Compared to Growth
Tax History
| Year | Tax Paid | Tax Assessment Tax Assessment Total Assessment is a certain percentage of the fair market value that is determined by local assessors to be the total taxable value of land and additions on the property. | Land | Improvement |
|---|---|---|---|---|
| 2024 | $7,302 | $62,537 | $13,403 | $49,134 |
| 2023 | $7,000 | $59,478 | $13,403 | $46,075 |
| 2022 | $6,437 | $53,590 | $11,659 | $41,931 |
| 2021 | $6,078 | $48,737 | $10,596 | $38,141 |
| 2020 | $6,223 | $49,461 | $10,596 | $38,865 |
| 2019 | $6,195 | $48,518 | $9,624 | $38,894 |
| 2018 | $5,850 | $45,402 | $9,624 | $35,778 |
| 2017 | $5,729 | $43,378 | $8,741 | $34,637 |
| 2016 | $5,553 | $41,527 | $7,281 | $34,246 |
| 2015 | $5,359 | $39,307 | $6,233 | $33,074 |
| 2013 | -- | $36,754 | $6,233 | $30,521 |
Source: Public Records
Map
Nearby Homes
- 6046 Redbud St
- 6246 Woodland Dr
- 6031 Lakecrest Dr
- 5900 Redbud St
- 5817 Millbrook St
- 21609 W 61st St
- 58.14 acres Woodland Dr
- 31.24 Acres of Woodland Dr
- 46.13 Acres of Woodland Dr
- 5725 Marion St
- 21309 W 56th St
- 21315 W 56th St
- 7943 Noble St
- 7939 Noble St
- 21217 W 55th Terrace
- 6753 Longview Rd
- 5405 Lakecrest Dr
- 6764 Longview Rd
- 6358 Hilltop St
- 22213 W 64th Terrace
- 6040 Theden St
- 6038 Longview Rd
- 21023 W 60th Terrace
- 21019 W 60th Terrace
- 6042 Longview Rd
- 21103 W 60th Terrace
- 21015 W 60th Terrace
- 6044 Theden St
- 6047 Theden St
- 21012 W 61st St
- 21018 W 61st St
- 6034 Longview Rd
- 21011 W 60th Terrace
- 6034 Longview Rd
- 21107 W 60th Terrace
- 6048 Theden St
- 6046 Longview Rd
- 21007 W 60th Terrace
- 6045 Redbud St
- 6041 Redbud St