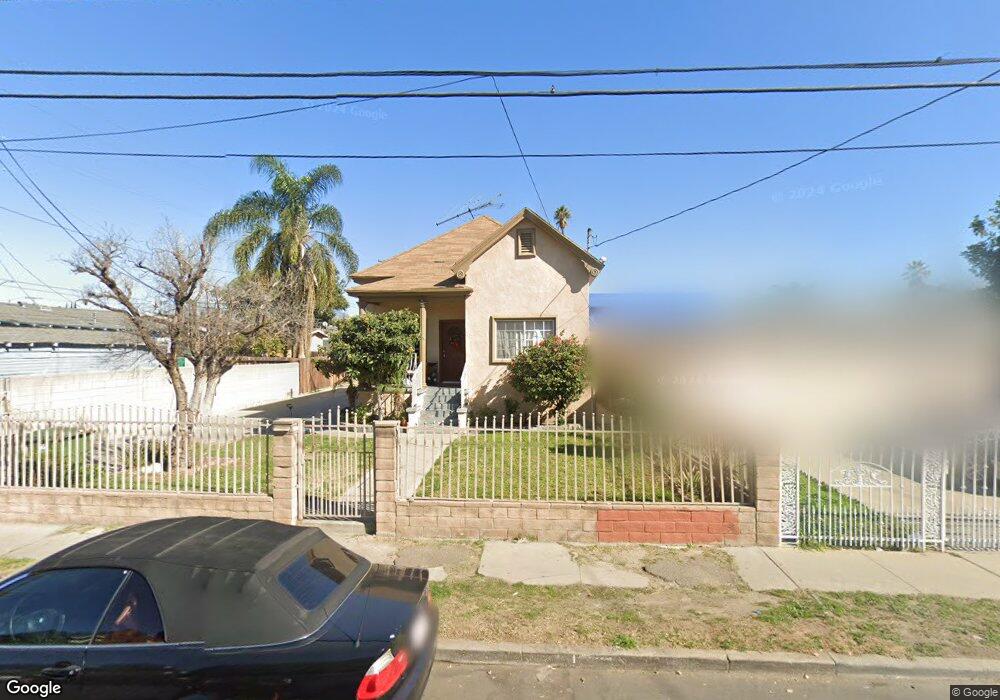
609 E 29th St Los Angeles, CA 90011
Historic South Central NeighborhoodEstimated Value: $610,000 - $1,055,000
2
Beds
1
Bath
996
Sq Ft
$751/Sq Ft
Est. Value
About This Home
This home is located at 609 E 29th St, Los Angeles, CA 90011 and is currently estimated at $747,569, approximately $750 per square foot. 609 E 29th St is a home located in Los Angeles County with nearby schools including Twenty-Eighth Street Elementary School, John Adams Middle School, and Santee Education Complex.
Ownership History
Date
Name
Owned For
Owner Type
Purchase Details
Closed on
Apr 27, 2018
Sold by
Fonseca Rafael
Bought by
Fonseca Celia
Current Estimated Value
Purchase Details
Closed on
Nov 7, 2006
Sold by
Fonseca Rafael and Fonseca Celia
Bought by
Fonseca Rafael
Home Financials for this Owner
Home Financials are based on the most recent Mortgage that was taken out on this home.
Original Mortgage
$160,000
Interest Rate
6.37%
Mortgage Type
New Conventional
Create a Home Valuation Report for This Property
The Home Valuation Report is an in-depth analysis detailing your home's value as well as a comparison with similar homes in the area
Home Values in the Area
Average Home Value in this Area
Purchase History
| Date | Buyer | Sale Price | Title Company |
|---|---|---|---|
| Fonseca Celia | -- | None Available | |
| Fonseca Rafael | -- | Service Link |
Source: Public Records
Mortgage History
| Date | Status | Borrower | Loan Amount |
|---|---|---|---|
| Closed | Fonseca Rafael | $160,000 |
Source: Public Records
Tax History
| Year | Tax Paid | Tax Assessment Tax Assessment Total Assessment is a certain percentage of the fair market value that is determined by local assessors to be the total taxable value of land and additions on the property. | Land | Improvement |
|---|---|---|---|---|
| 2025 | $3,890 | $306,697 | $220,215 | $86,482 |
| 2024 | $3,890 | $300,685 | $215,898 | $84,787 |
| 2023 | $3,819 | $294,790 | $211,665 | $83,125 |
| 2022 | $3,646 | $289,011 | $207,515 | $81,496 |
| 2021 | $3,600 | $283,346 | $203,447 | $79,899 |
| 2019 | $3,496 | $274,943 | $197,413 | $77,530 |
| 2018 | $3,421 | $269,553 | $193,543 | $76,010 |
| 2016 | $3,266 | $259,088 | $186,029 | $73,059 |
| 2015 | $3,220 | $255,197 | $183,235 | $71,962 |
| 2014 | $3,238 | $250,199 | $179,646 | $70,553 |
Source: Public Records
Map
Nearby Homes
Your Personal Tour Guide
Ask me questions while you tour the home.