6101 Fulton Ave Unit 9 Van Nuys, CA 91401
Estimated Value: $497,000 - $547,000
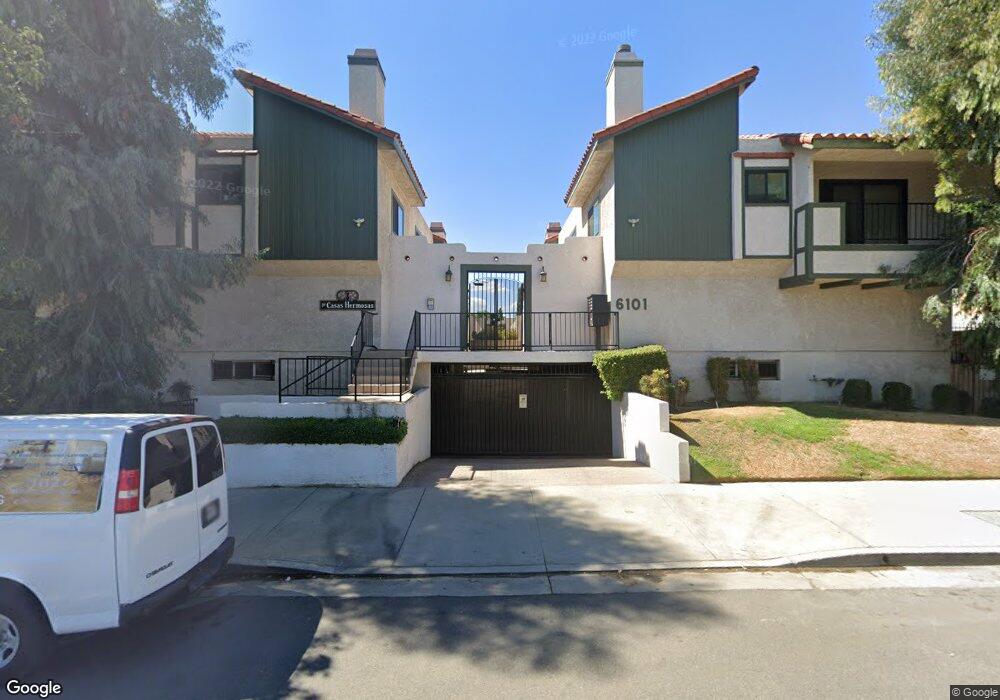
About This Home
This home is located at 6101 Fulton Ave Unit 9, Van Nuys, CA 91401 and is currently estimated at $522,087, approximately $453 per square foot. 6101 Fulton Ave Unit 9 is a home located in Los Angeles County with nearby schools including Erwin Street Elementary School, Ulysses S. Grant Senior High School, and Louis D. Armstrong Middle School.
Ownership History
Purchase Details
Home Financials for this Owner
Home Financials are based on the most recent Mortgage that was taken out on this home.Purchase Details
Purchase Details
Home Financials for this Owner
Home Financials are based on the most recent Mortgage that was taken out on this home.Home Values in the Area
Average Home Value in this Area
Purchase History
We collect this data history from publicly available records. To have your information removed, we recommend requesting removal directly through your county’s website.
| Date | Buyer | Sale Price | Title Company |
|---|---|---|---|
| Listengourt Denis | $213,000 | Fatcola | |
| The Bank Of New York | $221,400 | Accommodation | |
| Lilly Adrian | $397,500 | Southland Title Inland Empir |
Mortgage History
We collect this data history from publicly available records. To have your information removed, we recommend requesting removal directly through your county’s website.
| Date | Status | Borrower | Loan Amount |
|---|---|---|---|
| Open | Listengourt Denis | $191,678 | |
| Previous Owner | Lilly Adrian | $318,000 |
Tax History
| Year | Tax Paid | Tax Assessment Tax Assessment Total Assessment is a certain percentage of the fair market value that is determined by local assessors to be the total taxable value of land and additions on the property. | Land | Improvement |
|---|---|---|---|---|
| 2025 | $3,371 | $274,278 | $82,408 | $191,870 |
| 2024 | $3,318 | $268,901 | $80,793 | $188,108 |
| 2023 | $3,254 | $263,629 | $79,209 | $184,420 |
| 2022 | $3,102 | $258,460 | $77,656 | $180,804 |
| 2021 | $3,058 | $253,393 | $76,134 | $177,259 |
| 2019 | $2,964 | $245,879 | $73,877 | $172,002 |
| 2018 | $2,932 | $241,059 | $72,429 | $168,630 |
| 2016 | $2,790 | $231,700 | $69,617 | $162,083 |
| 2015 | $2,749 | $228,221 | $68,572 | $159,649 |
| 2014 | $2,762 | $223,751 | $67,229 | $156,522 |
Map
- 6101 Fulton Ave Unit 3
- 6034 Fulton Ave
- 6053 Atoll Ave
- 6026 Greenbush Ave
- 6119 Mary Ellen Ave
- 6043 Mary Ellen Ave
- 6250 Fulton Ave Unit 205
- 13430 Oxnard St
- 6249 Longridge Ave
- 13405 Tiara St
- 6110 Mary Ellen Ave
- 6038 Allott Ave
- 5857 Nagle Ave
- 13522 Delano St
- 6118 Ethel Ave
- 13413 Friar St
- 5836 Hillview Park Ave
- 13350 Victory Blvd
- 13022 Aetna St
- 13430 Victory Blvd
- 6101 Fulton Ave
- 6101 Fulton Ave Unit 10
- 6101 Fulton Ave Unit 7
- 6101 Fulton Ave Unit 6
- 6101 Fulton Ave Unit 5
- 6101 Fulton Ave Unit 4
- 6101 Fulton Ave Unit 2
- 6101 Fulton Ave Unit 1
- 6061 Fulton Ave Unit 7
- 6061 Fulton Ave
- 6061 Fulton Ave Unit 1
- 6061 Fulton Ave
- 6100 Nagle Ave
- 6106 Nagle Ave
- 6112 Nagle Ave
- 13326 Bessemer St
- 6062 Fulton Ave Unit 10
- 6062 Fulton Ave Unit 4
- 6062 Fulton Ave Unit 8
- 6118 Nagle Ave
Ask me questions while you tour the home.