620 Gamma Ct Campbell, CA 95008
San Tomas NeighborhoodAbout This Home
Discover Modern Living in a Prime Campbell Location!
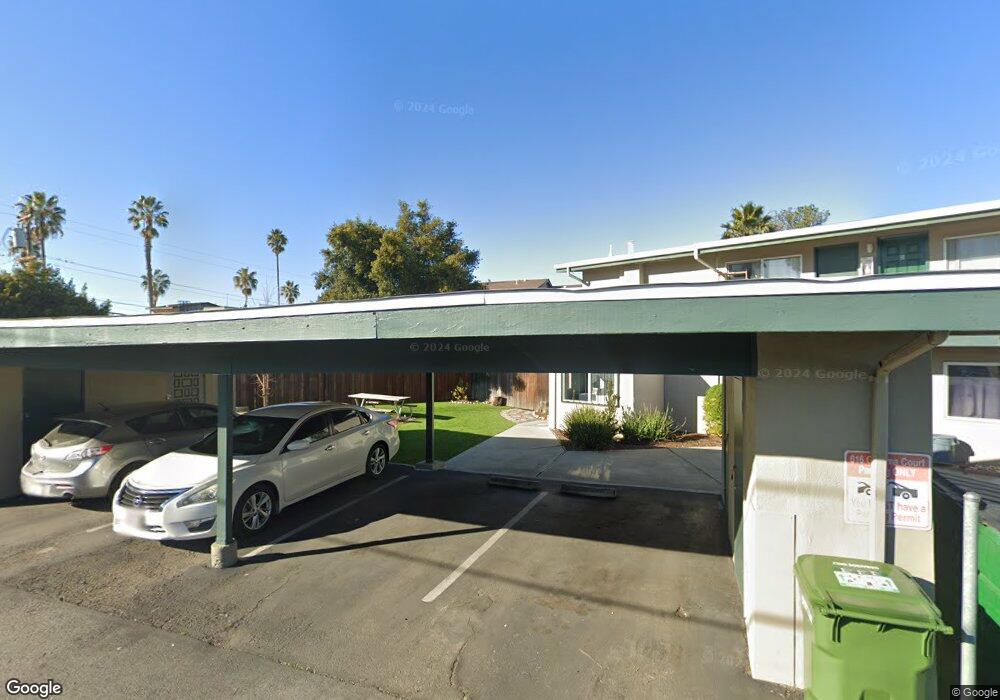
Experience the perfect blend of comfort and convenience in this beautifully renovated 2-bedroom, 1-bath apartment at 620 Gamma Ct, Unit #2 in city of Campbell, right on the border of Los Gatos.
This bright, first-floor home features a private backyard ideal for relaxing, entertaining, or simply enjoying the outdoors.
Located within the highly rated Campbell school district, the property offers unbeatable access to the best of the area. You'll be just minutes from downtown Campbell, downtown Los Gatos, Netflix headquarters, San Tomas Expressway, and Highways 17 & 85 keeping you close to work, schools, shopping, dining, and entertainment.
This gem won't last don't miss this rare opportunity to live in one of Campbell's most desirable neighborhoods!
Call or text today to schedule your private tour and experience this exceptional apartment firsthand.
Key Features:
- Spacious and bright living spaces
- Stainless steel appliances, including a dishwasher, in the kitchen
- Granite countertops
- Hardwood flooring
- Secure assigned parking space
- Private fenced patio/backyard
- Laundry room in the building
- Nice cul-de-sac location
- Down the street from a nice school playground
Pet-Friendly:
- Welcoming to one cat or a small dog under 30 pounds (subject to vaccination)
- Pamper your furry friend with a pet-friendly environment
- Additional $500 pet deposit required
Home Values in the Area
Average Home Value in this Area
Property History
| Date | Event | Price | List to Sale | Price per Sq Ft |
|---|---|---|---|---|
| 02/10/2025 02/10/25 | Off Market | $3,885 | -- | -- |
| 01/21/2025 01/21/25 | For Rent | -- | -- | -- |
| 10/08/2024 10/08/24 | Off Market | $3,885 | -- | -- |
| 10/01/2024 10/01/24 | For Rent | $3,885 | -- | -- |
Tax History
| Year | Tax Paid | Tax Assessment Tax Assessment Total Assessment is a certain percentage of the fair market value that is determined by local assessors to be the total taxable value of land and additions on the property. | Land | Improvement |
|---|---|---|---|---|
| 2025 | $12,737 | $858,378 | $429,189 | $429,189 |
| 2024 | $12,737 | $841,548 | $420,774 | $420,774 |
| 2023 | $12,586 | $825,048 | $412,524 | $412,524 |
| 2022 | $12,532 | $808,872 | $404,436 | $404,436 |
| 2021 | $12,210 | $793,012 | $396,506 | $396,506 |
| 2020 | $11,819 | $784,882 | $392,441 | $392,441 |
| 2019 | $11,566 | $769,494 | $384,747 | $384,747 |
| 2018 | $11,153 | $754,406 | $377,203 | $377,203 |
| 2017 | $10,921 | $739,614 | $369,807 | $369,807 |
| 2016 | $10,256 | $725,112 | $362,556 | $362,556 |
| 2015 | $10,041 | $714,222 | $357,111 | $357,111 |
| 2014 | $9,650 | $700,232 | $350,116 | $350,116 |
Map
- 786 Sharmon Palms Ln
- 738 Sobrato Dr
- 908 Marilyn Dr
- 963 Connie Dr
- 422 W Sunnyoaks Ave
- 2330 Maximilian Dr
- 492 W Hacienda Ave
- 295 Beverly Ct
- 2283 Lemoyne Way
- 4029 Sadie Ct
- 1001 Audrey Ave
- 1054 Steinway Ave
- 14 Timber Cove Dr Unit 14
- 1089 Audrey Ave
- 186 W Rincon Ave
- 47 Dot Ave Unit D
- 870 Camden Ave Unit 96
- 99 Timber Cove Dr Unit 99
- 122 Timber Cove Dr Unit 122
- 63 Braxton Terrace
- 620 Gamma Ct Unit 2
- 620 Gamma Ct Unit 4
- 620 Gamma Ct Unit 1
- 619 Gamma Ct
- 616 Gamma Ct
- 778 Sharmon Palms Ln
- 615 Gamma Ct
- 606 Gamma Ct
- 808 Sharmon Palms Ln
- 768 Sharmon Palms Ln
- 605 Gamma Ct
- 629 Laura Dr
- 621 Laura Dr
- 754 Sharmon Palms Ln
- 820 Sharmon Palms Ln
- 611 Laura Dr Unit C
- 611 Laura Dr Unit A
- 611 Laura Dr
- 680 Waldo Rd
- 640 Waldo Rd
Ask me questions while you tour the home.