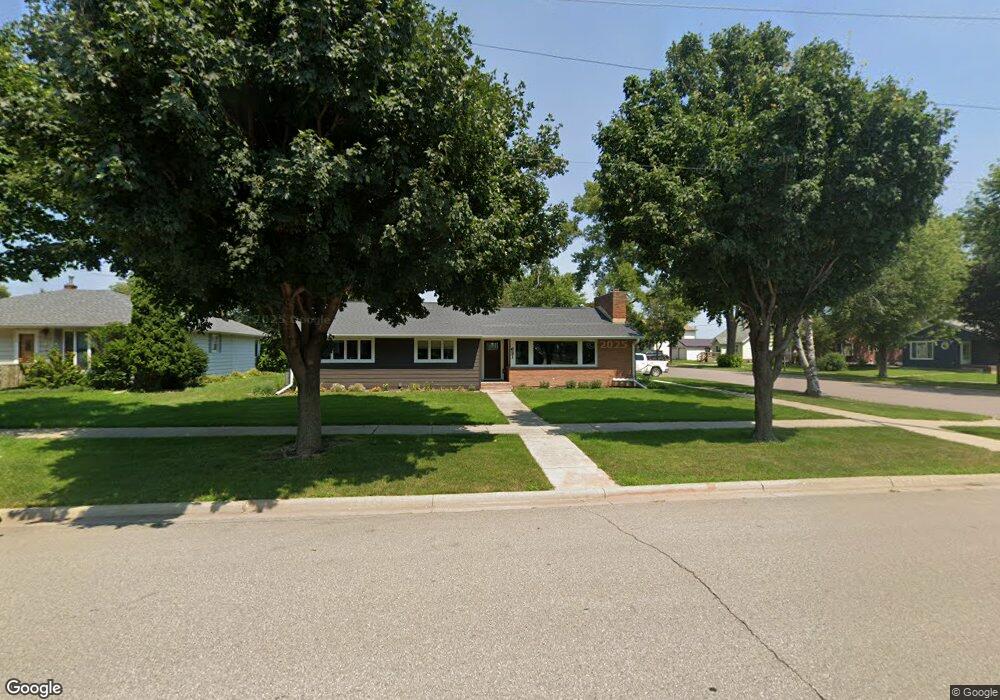
621 5th St SE Pipestone, MN 56164
Estimated Value: $148,000 - $329,000
--
Bed
--
Bath
--
Sq Ft
8,712
Sq Ft Lot
About This Home
This home is located at 621 5th St SE, Pipestone, MN 56164 and is currently estimated at $206,296. 621 5th St SE is a home located in Pipestone County with nearby schools including Brown Elementary School, Pipestone Elementary School, and Heartland Elementary School.
Ownership History
Date
Name
Owned For
Owner Type
Purchase Details
Closed on
Dec 11, 2020
Sold by
Schulze Steven R and Schulze Kim L
Bought by
Wacker Jeffrey and Wacker Jody
Current Estimated Value
Purchase Details
Closed on
Jul 30, 2018
Sold by
Caster Wesley V and Caster Danika J
Bought by
Schulze Steven R and Schulze Kim L
Purchase Details
Closed on
Jan 10, 2018
Sold by
Schulze Steven R and Schulze Kim L
Bought by
Caster Westley V and Caster Danika J
Create a Home Valuation Report for This Property
The Home Valuation Report is an in-depth analysis detailing your home's value as well as a comparison with similar homes in the area
Home Values in the Area
Average Home Value in this Area
Purchase History
| Date | Buyer | Sale Price | Title Company |
|---|---|---|---|
| Wacker Jeffrey | $115,000 | Pipestone Abstract & Title C | |
| Schulze Steven R | -- | None Available | |
| Caster Westley V | $124,000 | None Available |
Source: Public Records
Tax History Compared to Growth
Tax History
| Year | Tax Paid | Tax Assessment Tax Assessment Total Assessment is a certain percentage of the fair market value that is determined by local assessors to be the total taxable value of land and additions on the property. | Land | Improvement |
|---|---|---|---|---|
| 2025 | $2,808 | $194,800 | $9,200 | $185,600 |
| 2024 | $2,808 | $182,100 | $9,200 | $172,900 |
| 2023 | $2,040 | $171,200 | $9,200 | $162,000 |
| 2022 | $1,584 | $142,100 | $6,600 | $135,500 |
| 2021 | $1,946 | $110,600 | $6,600 | $104,000 |
| 2020 | $1,850 | $110,600 | $6,600 | $104,000 |
| 2019 | $388 | $108,500 | $5,300 | $103,200 |
| 2018 | $354 | $32,200 | $5,300 | $26,900 |
| 2017 | $366 | $29,800 | $5,300 | $24,500 |
| 2016 | $336 | $0 | $0 | $0 |
| 2015 | $382 | $17,900 | $2,943 | $14,957 |
| 2014 | $382 | $18,400 | $2,946 | $15,454 |
Source: Public Records
Map
Nearby Homes
- 504 4th St SE
- 510 5th St SE
- 109 5th Ave SE
- 504 3rd Ave SE
- 804 6th Ave SE
- 408 2nd St NE
- 617 S Hiawatha Ave
- 219 3rd Ave SW
- 150 Ridgeview Dr
- 919 3rd Ave SW
- 743 6th Ave SW
- 202 7th Ave SW
- 718 7th St SW
- 215 8th Ave SW
- 901 7th Ave SW
- 903 7th Ave SW
- 821 7th St SW
- 418 14th St SW
- 913 9th Ave SW
- 1102 9th Ave SW