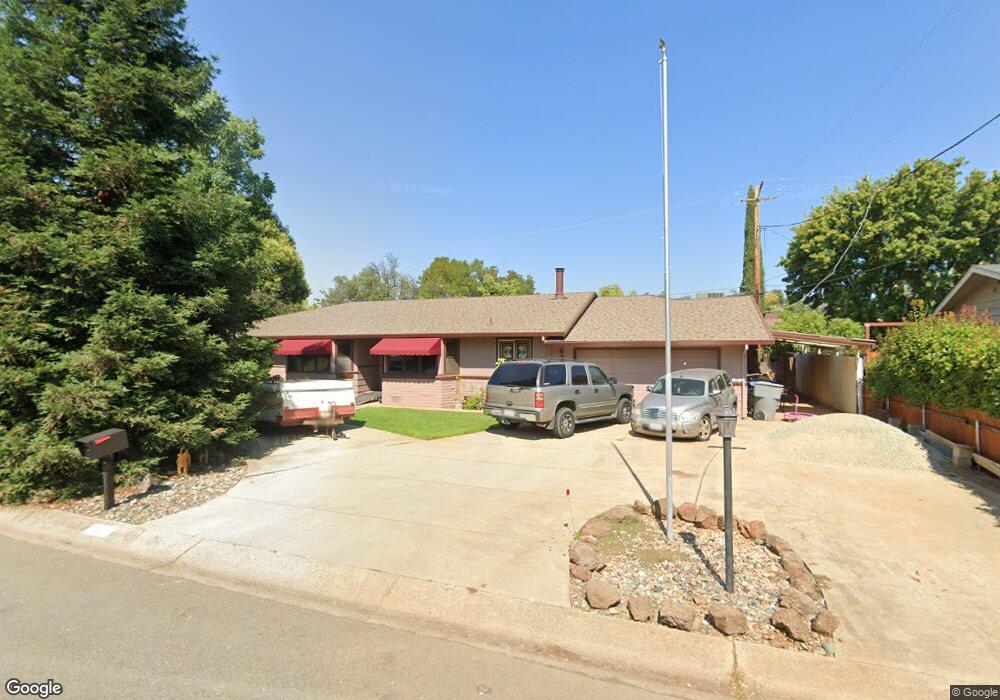
638 Julie Way Redding, CA 96002
South Bechelli NeighborhoodEstimated Value: $547,637 - $637,000
4
Beds
3
Baths
3,300
Sq Ft
$178/Sq Ft
Est. Value
About This Home
This home is located at 638 Julie Way, Redding, CA 96002 and is currently estimated at $586,159, approximately $177 per square foot. 638 Julie Way is a home located in Shasta County with nearby schools including Lassen View Elementary School, Parsons Junior High School, and Enterprise High School.
Ownership History
Date
Name
Owned For
Owner Type
Purchase Details
Closed on
Apr 5, 2001
Sold by
Sullivan John J
Bought by
Pokorney Alan and Pokorney Tamara S
Current Estimated Value
Purchase Details
Closed on
Apr 15, 1999
Sold by
Sullivan Norene B
Bought by
Sullivan John J
Home Financials for this Owner
Home Financials are based on the most recent Mortgage that was taken out on this home.
Original Mortgage
$5,000
Interest Rate
7.2%
Mortgage Type
Seller Take Back
Create a Home Valuation Report for This Property
The Home Valuation Report is an in-depth analysis detailing your home's value as well as a comparison with similar homes in the area
Home Values in the Area
Average Home Value in this Area
Purchase History
| Date | Buyer | Sale Price | Title Company |
|---|---|---|---|
| Pokorney Alan | $215,000 | Alliance Title Company | |
| Sullivan John J | -- | Chicago Title Co |
Source: Public Records
Mortgage History
| Date | Status | Borrower | Loan Amount |
|---|---|---|---|
| Previous Owner | Sullivan John J | $5,000 |
Source: Public Records
Tax History
| Year | Tax Paid | Tax Assessment Tax Assessment Total Assessment is a certain percentage of the fair market value that is determined by local assessors to be the total taxable value of land and additions on the property. | Land | Improvement |
|---|---|---|---|---|
| 2025 | $3,542 | $333,532 | $37,654 | $295,878 |
| 2024 | $3,390 | $326,993 | $36,916 | $290,077 |
| 2023 | $3,390 | $311,367 | $36,193 | $275,174 |
| 2022 | $3,293 | $305,263 | $35,484 | $269,779 |
| 2021 | $3,179 | $299,279 | $34,789 | $264,490 |
| 2020 | $3,165 | $296,211 | $34,433 | $261,778 |
| 2019 | $3,138 | $290,404 | $33,758 | $256,646 |
| 2018 | $3,101 | $284,711 | $33,097 | $251,614 |
| 2017 | $3,155 | $279,130 | $32,449 | $246,681 |
| 2016 | $2,949 | $273,658 | $31,813 | $241,845 |
| 2015 | $2,924 | $269,549 | $31,336 | $238,213 |
| 2014 | $2,902 | $264,270 | $30,723 | $233,547 |
Source: Public Records
Map
Nearby Homes
- 3635 Traverse St
- 664 Julie Way
- 671 Estate St
- 3691 Traverse St
- 3656 Traverse St
- 687 Estate St
- 599 Julie Way
- 3707 Traverse St
- 609 Estate St
- 705 Estate St
- 662 Estate St
- 646 Estate St
- 578 Julie Way
- 3708 Victoire Way
- 680 Estate St
- 628 Estate St
- 593 Estate St
- 721 Estate St
- 3673 Victoire Way
- 731 Terrace Dr
Your Personal Tour Guide
Ask me questions while you tour the home.