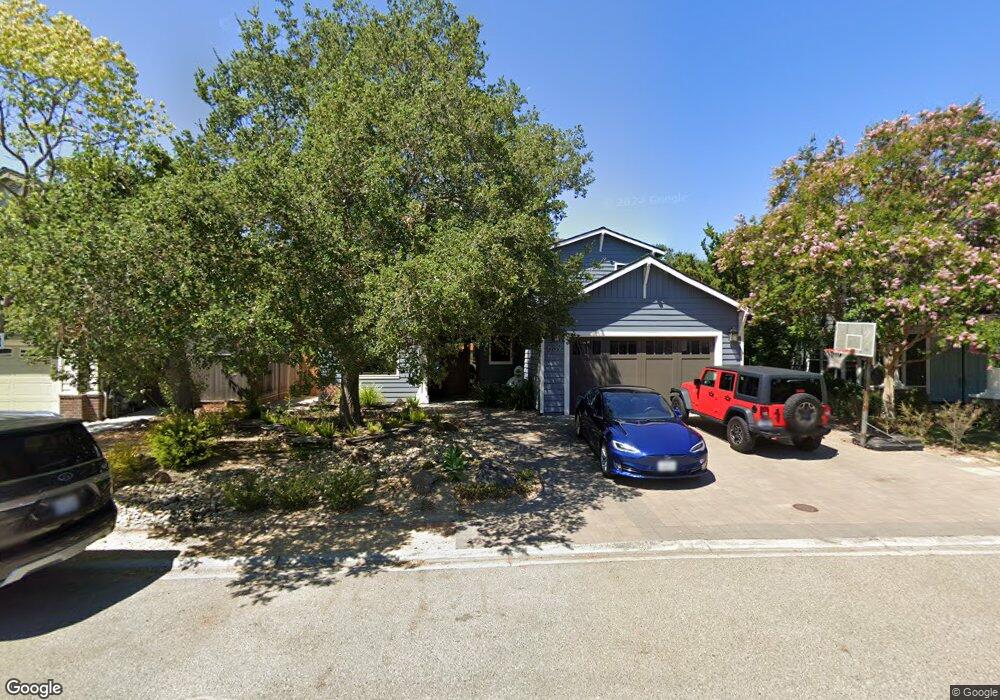
639 Peachtree Ct Campbell, CA 95008
San Tomas NeighborhoodEstimated Value: $3,087,000 - $3,801,511
4
Beds
2
Baths
3,691
Sq Ft
$954/Sq Ft
Est. Value
About This Home
This home is located at 639 Peachtree Ct, Campbell, CA 95008 and is currently estimated at $3,522,878, approximately $954 per square foot. 639 Peachtree Ct is a home located in Santa Clara County with nearby schools including Westmont High School, Rolling Hills Middle, and Village School.
Ownership History
Date
Name
Owned For
Owner Type
Purchase Details
Closed on
Nov 2, 2014
Sold by
Flynn William Patrick and Flynn Carrie Kienholz
Bought by
The W Patrick Flynn & Carrie K Flynn 201 and Flynn Carrie K
Current Estimated Value
Purchase Details
Closed on
Aug 21, 2008
Sold by
Castello Alan D and Nettleton Nancy A
Bought by
Flynn William Patrick and Flynn Carrie Kienholz
Home Financials for this Owner
Home Financials are based on the most recent Mortgage that was taken out on this home.
Original Mortgage
$729,750
Outstanding Balance
$477,542
Interest Rate
6.27%
Mortgage Type
Purchase Money Mortgage
Estimated Equity
$3,045,336
Purchase Details
Closed on
Jan 21, 2002
Sold by
Castello Alan D and Nettleton Nancy A
Bought by
Castello Alan D and Nettleton Nancy A
Purchase Details
Closed on
Apr 16, 1996
Sold by
36 Campbell Associates Lp
Bought by
Castello Alan D and Nettleton Nancy A
Home Financials for this Owner
Home Financials are based on the most recent Mortgage that was taken out on this home.
Original Mortgage
$390,700
Interest Rate
5.5%
Create a Home Valuation Report for This Property
The Home Valuation Report is an in-depth analysis detailing your home's value as well as a comparison with similar homes in the area
Home Values in the Area
Average Home Value in this Area
Purchase History
| Date | Buyer | Sale Price | Title Company |
|---|---|---|---|
| The W Patrick Flynn & Carrie K Flynn 201 | -- | None Available | |
| Flynn William Patrick | $1,237,500 | First American Title Co | |
| Castello Alan D | -- | -- | |
| Castello Alan D | $488,500 | Old Republic Title Company |
Source: Public Records
Mortgage History
| Date | Status | Borrower | Loan Amount |
|---|---|---|---|
| Open | Flynn William Patrick | $729,750 | |
| Previous Owner | Castello Alan D | $390,700 | |
| Closed | Castello Alan D | $48,800 |
Source: Public Records
Tax History Compared to Growth
Tax History
| Year | Tax Paid | Tax Assessment Tax Assessment Total Assessment is a certain percentage of the fair market value that is determined by local assessors to be the total taxable value of land and additions on the property. | Land | Improvement |
|---|---|---|---|---|
| 2025 | $32,743 | $2,695,707 | $1,194,909 | $1,500,798 |
| 2024 | $32,743 | $2,642,851 | $1,171,480 | $1,471,371 |
| 2023 | $32,273 | $2,591,031 | $1,148,510 | $1,442,521 |
| 2022 | $31,989 | $2,540,228 | $1,125,991 | $1,414,237 |
| 2021 | $31,440 | $2,490,420 | $1,103,913 | $1,386,507 |
| 2020 | $30,641 | $2,464,885 | $1,092,594 | $1,372,291 |
| 2019 | $18,474 | $1,446,673 | $1,071,171 | $375,502 |
| 2018 | $17,901 | $1,418,308 | $1,050,168 | $368,140 |
| 2017 | $17,655 | $1,390,499 | $1,029,577 | $360,922 |
| 2016 | $16,604 | $1,345,977 | $1,009,390 | $336,587 |
| 2015 | $16,145 | $1,325,761 | $994,229 | $331,532 |
| 2014 | $14,773 | $1,225,000 | $918,700 | $306,300 |
Source: Public Records
Map
Nearby Homes
- 107 Naramore Ln
- 101 Peach Willow Ct
- 1170 Steinway Ave
- 14225 Lora Dr Unit 90
- 14225 Lora Dr Unit 36
- 14225 Lora Dr Unit 70
- 1097-1099 W Hacienda Ave
- 4736 Westmont Ave
- 232 More Ave
- 142 Calle Larga
- 915 Bucknam Ave
- 4994 Peach Terrace
- 135 El Pinar
- 1694 Hyde Dr
- 207 Palmer Dr
- 14145 Capri Dr
- 1697 Hyde Dr
- 118 Via Lago
- 105 Rio Vista
- 1162 Capri Dr
- 651 Peachtree Ct
- 635 Peachtree Ct
- 1566 Walters Ave
- 631 Peachtree Ct
- 655 Peachtree Ct
- 807 Miller Ave
- 1556 Walters Ave
- 1384 York Ave
- 1570 Walters Ave
- 627 Peachtree Ct
- 1390 York Ave
- 659 Peachtree Ct
- 1366 York Ave
- 1400 York Ave
- 805 Miller Ave
- 727 Peachtree Ct
- 623 Peachtree Ct
- 1420 York Ave
- 1590 Walters Ave
- 803 Miller Ave