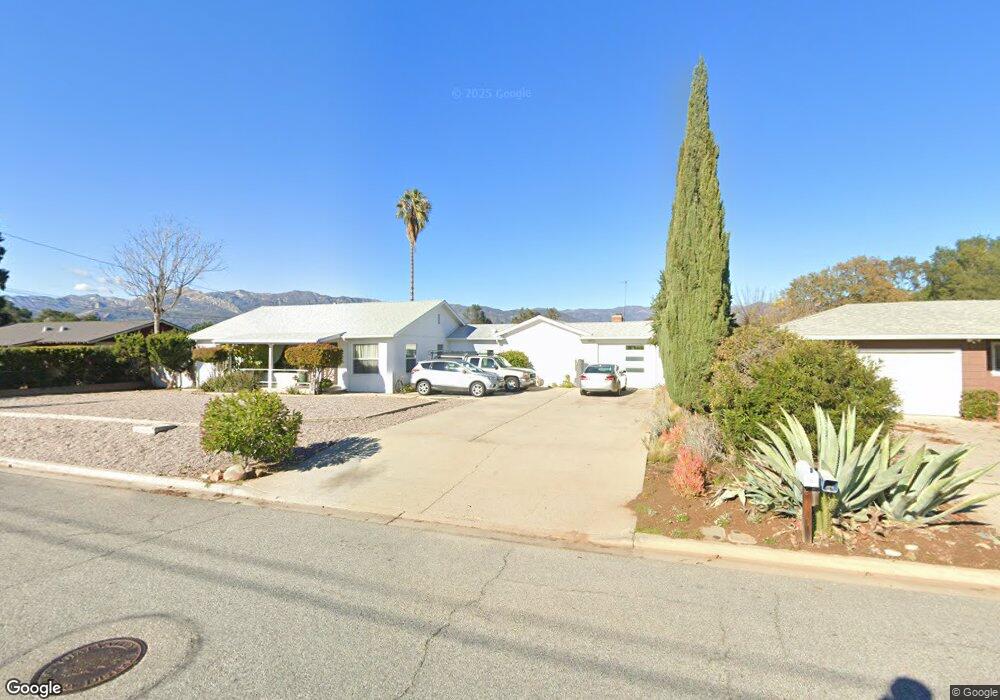
65 Kunkle St Oak View, CA 93022
Estimated Value: $866,000 - $1,178,000
3
Beds
1
Bath
1,384
Sq Ft
$703/Sq Ft
Est. Value
About This Home
This home is located at 65 Kunkle St, Oak View, CA 93022 and is currently estimated at $973,065, approximately $703 per square foot. 65 Kunkle St is a home located in Ventura County with nearby schools including Sunset Elementary School, De Anza Academy Of Technology And The Arts, and Ventura High School.
Ownership History
Date
Name
Owned For
Owner Type
Purchase Details
Closed on
Nov 16, 2020
Sold by
Lozano Paul C and Lozano Maria
Bought by
Lozano Paul C and Lozano Maria
Current Estimated Value
Home Financials for this Owner
Home Financials are based on the most recent Mortgage that was taken out on this home.
Original Mortgage
$545,425
Interest Rate
2.8%
Mortgage Type
VA
Purchase Details
Closed on
Jul 13, 2018
Sold by
Zimmerman Thomas P and Zimmerman Susan G
Bought by
Zimmerman Thomas P and Zimmerman Susan G
Purchase Details
Closed on
Jun 8, 2017
Sold by
Lozano Paul C and Lozano Maria
Bought by
Lozano Paul C and Lozano Maria
Home Financials for this Owner
Home Financials are based on the most recent Mortgage that was taken out on this home.
Original Mortgage
$565,000
Interest Rate
4.02%
Mortgage Type
VA
Purchase Details
Closed on
Jun 28, 2007
Sold by
Lozano Paul C and Lozano Maria
Bought by
Lozano Paul C and Lozano Maria
Create a Home Valuation Report for This Property
The Home Valuation Report is an in-depth analysis detailing your home's value as well as a comparison with similar homes in the area
Home Values in the Area
Average Home Value in this Area
Purchase History
| Date | Buyer | Sale Price | Title Company |
|---|---|---|---|
| Lozano Paul C | -- | Timios Title A Ca Corp | |
| Zimmerman Thomas P | -- | None Available | |
| Lozano Paul C | -- | First American Title Company | |
| Lozano Paul C | -- | First American Title Company | |
| Lozano Paul C | -- | None Available |
Source: Public Records
Mortgage History
| Date | Status | Borrower | Loan Amount |
|---|---|---|---|
| Closed | Lozano Paul C | $545,425 | |
| Closed | Lozano Paul C | $565,000 |
Source: Public Records
Tax History
| Year | Tax Paid | Tax Assessment Tax Assessment Total Assessment is a certain percentage of the fair market value that is determined by local assessors to be the total taxable value of land and additions on the property. | Land | Improvement |
|---|---|---|---|---|
| 2025 | $3,554 | $420,318 | $260,829 | $159,489 |
| 2024 | $3,554 | $412,077 | $255,715 | $156,362 |
| 2023 | $3,547 | $403,998 | $250,701 | $153,297 |
| 2022 | $3,457 | $396,077 | $245,785 | $150,292 |
| 2021 | $3,393 | $388,311 | $240,965 | $147,346 |
| 2020 | $3,381 | $384,332 | $238,496 | $145,836 |
| 2019 | $3,327 | $376,797 | $233,820 | $142,977 |
| 2018 | $3,288 | $369,410 | $229,236 | $140,174 |
| 2017 | $3,248 | $362,168 | $224,742 | $137,426 |
| 2016 | $4,465 | $355,068 | $220,336 | $134,732 |
| 2015 | $4,411 | $349,736 | $217,027 | $132,709 |
| 2014 | $4,336 | $342,887 | $212,777 | $130,110 |
Source: Public Records
Map
Nearby Homes
- 543 Good Hope St
- 182 Mountain View St
- 109 Portal St
- 110 E Oak View Ave
- 385 Sunset Ave
- 130 Olive St
- 75 Maxine Ave
- 10505 Dale Ave
- 358 Sunset Ct
- 1176 N Ventura Ave
- 1125 Spring St
- 0 Thomas St
- 700 Thomas St
- 350 Riverside Rd
- 10681 Encino Dr
- 10920 Ventura Ave
- 401 Burnham Rd
- 10980 N Ventura Ave
- 10945 Alto Ct
- 10995 Alto Ct
Your Personal Tour Guide
Ask me questions while you tour the home.