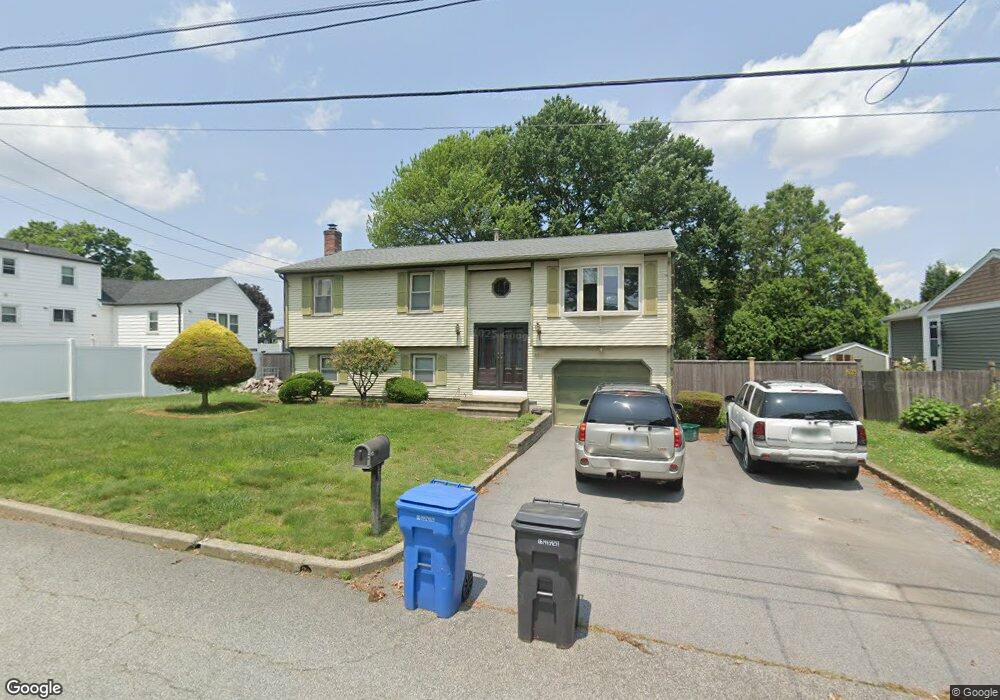
65 Salem Ave Cranston, RI 02920
Budlong NeighborhoodEstimated Value: $377,000 - $553,000
3
Beds
1
Bath
1,740
Sq Ft
$257/Sq Ft
Est. Value
About This Home
This home is located at 65 Salem Ave, Cranston, RI 02920 and is currently estimated at $446,788, approximately $256 per square foot. 65 Salem Ave is a home located in Providence County with nearby schools including Woodridge Elementary School, Western Hills Middle School, and Cranston High School West.
Ownership History
Date
Name
Owned For
Owner Type
Purchase Details
Closed on
Feb 11, 2000
Sold by
Pagliarini Dennis R and Pagliarini Donna
Bought by
Campanini Joseph R
Current Estimated Value
Home Financials for this Owner
Home Financials are based on the most recent Mortgage that was taken out on this home.
Original Mortgage
$152,000
Outstanding Balance
$48,014
Interest Rate
7.98%
Mortgage Type
Purchase Money Mortgage
Estimated Equity
$398,774
Create a Home Valuation Report for This Property
The Home Valuation Report is an in-depth analysis detailing your home's value as well as a comparison with similar homes in the area
Home Values in the Area
Average Home Value in this Area
Purchase History
| Date | Buyer | Sale Price | Title Company |
|---|---|---|---|
| Campanini Joseph R | $152,000 | -- |
Source: Public Records
Mortgage History
| Date | Status | Borrower | Loan Amount |
|---|---|---|---|
| Open | Campanini Joseph R | $10,828 | |
| Open | Campanini Joseph R | $152,000 |
Source: Public Records
Tax History Compared to Growth
Tax History
| Year | Tax Paid | Tax Assessment Tax Assessment Total Assessment is a certain percentage of the fair market value that is determined by local assessors to be the total taxable value of land and additions on the property. | Land | Improvement |
|---|---|---|---|---|
| 2025 | $4,898 | $352,900 | $102,500 | $250,400 |
| 2024 | $4,803 | $352,900 | $102,500 | $250,400 |
| 2023 | $4,453 | $235,600 | $67,500 | $168,100 |
| 2022 | $4,355 | $235,300 | $67,500 | $167,800 |
| 2021 | $4,235 | $235,300 | $67,500 | $167,800 |
| 2020 | $4,281 | $206,100 | $64,300 | $141,800 |
| 2019 | $4,281 | $206,100 | $64,300 | $141,800 |
| 2018 | $4,182 | $206,100 | $64,300 | $141,800 |
| 2017 | $4,265 | $185,900 | $57,900 | $128,000 |
| 2016 | $4,173 | $185,900 | $57,900 | $128,000 |
| 2015 | $4,173 | $185,900 | $57,900 | $128,000 |
| 2014 | $3,833 | $167,800 | $57,900 | $109,900 |
Source: Public Records
Map
Nearby Homes
- 99 Salem Ave
- 69 W View Ave
- 0 Rutland St
- 210 Hyde St
- 111 Belgium St
- 446 Budlong Rd
- 80 Phenix Ave
- 34 Aldrich Ave
- 1455 Park Ave Unit 3
- 10 Sheffield Rd
- 71 Norton Ave
- 21 Charles St
- 141 Glen Ridge Rd
- 46 Roslyn Ave
- 92 Rhode Island St
- 54 Randall St
- 46 Lilyana Way
- 55 Columbus Blvd
- 86 Sherwood St
- 14 New Hampshire St