NOT LISTED FOR SALE

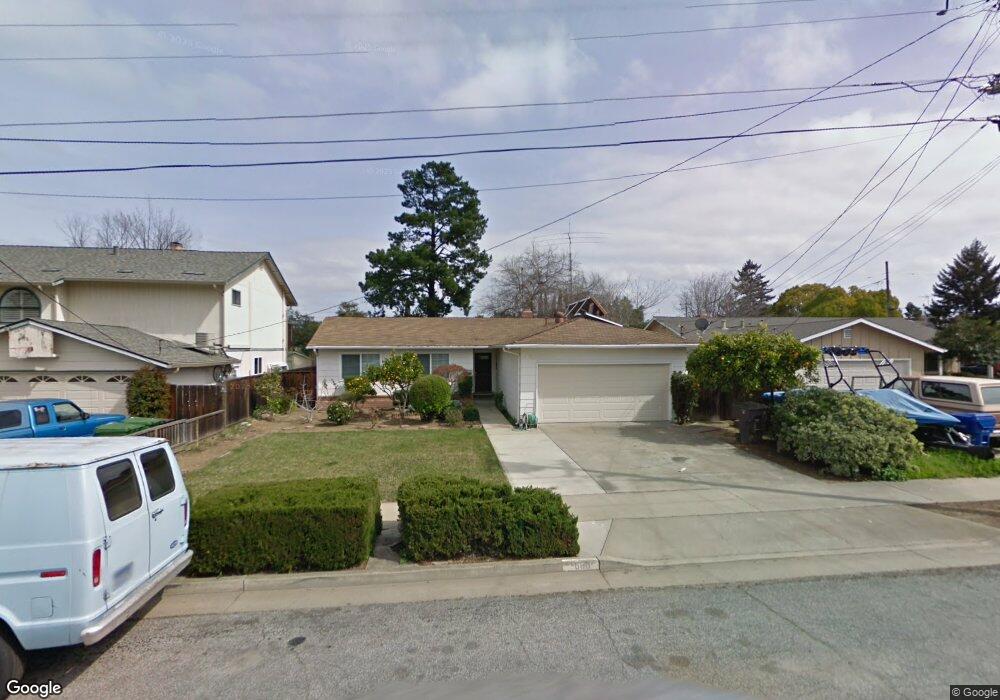
Estimated Value: $1,668,000 - $2,576,000

3 Beds
2 Baths
1,276 Sq Ft
$1,558/Sq Ft Est. Value

Last Sold July 18, 2013

Last sale price $740,000 $580 Per Sq Ft

Est. 169% increase in value since last sale

Current estimated payment $11,555/month

About This Home

As of July 2013

Remodeled charming home in Campbell,move in condition w new interior & exterior paint,back yard w deck & new lawn & storage shed,updated kitchen & baths.largeLR/DR comb w refinished hardwood flr. 2-way fireplace for LR/FR.enclosed patio can be office/breakfast rm(permit unknown,not counting toward sq ft). 2 yrs new composition roof.AwardWinning Campbell schools-Capri,RolllingHills,Westmont.staged

Ownership History

Date Name Owned For Owner Type

Purchase Details

Listed on
Jun 5, 2013
Closed on
Jul 9, 2013
Sold by
Tien Kent and Tien Linda
Bought by
Siddiqi Waseem and Siddiqi Saba
Seller's Agent
LI WANG
Coldwell Banker Realty
Buyer's Agent
Annette Sloan
Asante Real Estate- Mountain View
List Price
$738,999
Sold Price
$740,000
Premium/Discount to List
$1,001
0.14%
Current Estimated Value
$1,988,562

Home Financials for this Owner

Home Financials are based on the most recent Mortgage that was taken out on this home.
Estimated Appreciation
$1,248,562
Avg. Annual Appreciation
8.42%
Original Mortgage
$465,000
Outstanding Balance
$337,407
Interest Rate
3.87%
Mortgage Type
Adjustable Rate Mortgage/ARM
Estimated Equity
$1,651,155
Source: Public Records

Range of Values:

Collateral Analytics

Collateral Analytics Collateral Analytics AVMs (Automated Valuation Model) employ a number of statistical approaches combined with neighborhood-specific comparable selection guarantees the most up-to-date and precise valuations.

Not Available

Collateral Analytics does not have data for the current month. Please view the chart for historical values.

ICE

ICE Mortgage Technology ICE Mortgage Technology’s AVM (Automated Valuation Model) is a state-of-the-art online residential property valuation tool that provides a quick and accurate estimate of the value of almost any home in the U.S.

Not Available

ICE Mortgage Technology does not have data for the current month. Please view the chart for historical values.

First American

First American First American Data & Analytics’ next-generation AVM combines unrivaled data assets with a blended ensemble of valuation models to produce highly accurate, reliable valuations you can trust.

Not Available

First American does not have data for the current month. Please view the chart for historical values.

Quantarium

Quantarium Quantarium’s valuation service, repeatedly proven the industry’s most accurate and comprehensive, is supercharged with a self-learning and auto-tuning AI engine that continually becomes smarter and more accurate as it processes daily inputs from the industry’s leading RE data lake.

Not Available

Quantarium does not have data for the current month. Please view the chart for historical values.

Average Value
Not Available
List Price
Sold Price
Create a Home Valuation Report for This Property
The Home Valuation Report is an in-depth analysis detailing your home's value as well as a comparison with similar homes in the area

Home Values in the Area

Source: Public Records

Average Home Value in this Area


Source: Public Records

Purchase History

Date Buyer Sale Price Title Company
Siddiqi Waseem $740,000 Cornerstone Title Company
Source: Public Records

Mortgage History

Date Status Borrower Loan Amount
Open Siddiqi Waseem $465,000
Source: Public Records

Property History

Date Event Price List to Sale Price per Sq Ft Prior Sale
07/18/2013 07/18/13 Sold $740,000 +0.1% $580 / Sq Ft View Prior Sale
06/13/2013 06/13/13 Pending -- -- --
06/05/2013 06/05/13 For Sale $738,999 -- $579 / Sq Ft

Tax History Compared to Growth

Source: Public Records

Tax History

Year Tax Paid Tax Assessment Tax Assessment Total Assessment is a certain percentage of the fair market value that is determined by local assessors to be the total taxable value of land and additions on the property. Land Improvement
2025 $11,646 $907,127 $680,347 $226,780
2024 $11,646 $889,341 $667,007 $222,334
2023 $11,487 $871,904 $653,929 $217,975
2022 $11,426 $854,808 $641,107 $213,701
2021 $11,214 $838,048 $628,537 $209,511
2020 $10,920 $829,456 $622,093 $207,363
2019 $10,762 $813,194 $609,896 $203,298
2018 $10,426 $797,250 $597,938 $199,312
2017 $10,273 $781,618 $586,214 $195,404
2016 $9,659 $766,293 $574,720 $191,573
2015 $9,492 $754,784 $566,088 $188,696
2014 $9,153 $740,000 $555,000 $185,000
Source: Public Records

Agents Affiliated with this Home

  • Section Image
  • Section Image
See All Agents

Map