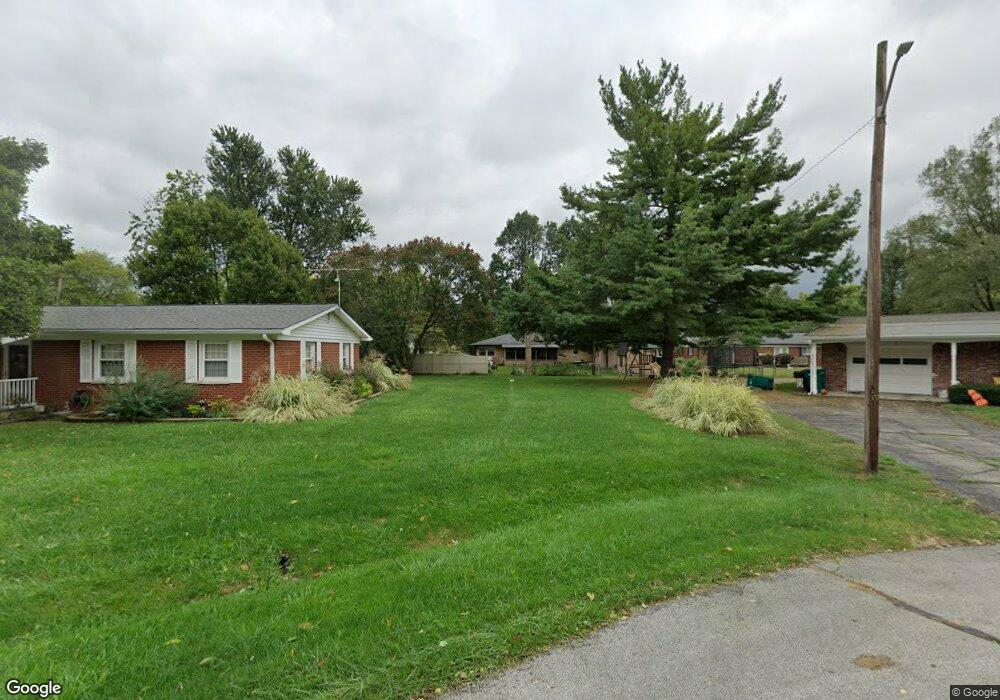
6620 Gasden Ct Plainfield, IN 46168
Estimated Value: $315,584 - $351,000
4
Beds
3
Baths
2,128
Sq Ft
$153/Sq Ft
Est. Value
About This Home
This home is located at 6620 Gasden Ct, Plainfield, IN 46168 and is currently estimated at $325,396, approximately $152 per square foot. 6620 Gasden Ct is a home located in Hendricks County with nearby schools including Clarks Creek Elementary, Plainfield Community Middle School, and Plainfield High School.
Ownership History
Date
Name
Owned For
Owner Type
Purchase Details
Closed on
Jul 29, 2011
Sold by
Storm Matthew R and Storm Julie M
Bought by
Scamihorn Karen L and Chevrier Catherine I
Current Estimated Value
Purchase Details
Closed on
Jun 30, 2006
Sold by
Fannie Mae
Bought by
Storm Matthew R and Storm Jullie M
Home Financials for this Owner
Home Financials are based on the most recent Mortgage that was taken out on this home.
Original Mortgage
$127,000
Interest Rate
6.72%
Mortgage Type
New Conventional
Purchase Details
Closed on
Mar 28, 2006
Sold by
Mortgage Electronic Registration Systems
Bought by
Federal National Mortgage Association
Purchase Details
Closed on
Mar 16, 2006
Sold by
Frentz Lisa
Bought by
Mortgage Electronic Registration Inc
Create a Home Valuation Report for This Property
The Home Valuation Report is an in-depth analysis detailing your home's value as well as a comparison with similar homes in the area
Home Values in the Area
Average Home Value in this Area
Purchase History
| Date | Buyer | Sale Price | Title Company |
|---|---|---|---|
| Scamihorn Karen L | -- | None Available | |
| Storm Matthew R | -- | None Available | |
| Federal National Mortgage Association | -- | None Available | |
| Mortgage Electronic Registration Inc | -- | None Available |
Source: Public Records
Mortgage History
| Date | Status | Borrower | Loan Amount |
|---|---|---|---|
| Previous Owner | Storm Matthew R | $127,000 |
Source: Public Records
Tax History Compared to Growth
Tax History
| Year | Tax Paid | Tax Assessment Tax Assessment Total Assessment is a certain percentage of the fair market value that is determined by local assessors to be the total taxable value of land and additions on the property. | Land | Improvement |
|---|---|---|---|---|
| 2024 | $2,441 | $264,000 | $44,400 | $219,600 |
| 2023 | $2,089 | $235,700 | $39,700 | $196,000 |
| 2022 | $3,072 | $219,700 | $36,700 | $183,000 |
| 2021 | $1,756 | $184,500 | $33,400 | $151,100 |
| 2020 | $1,724 | $181,600 | $33,400 | $148,200 |
| 2019 | $1,599 | $173,400 | $31,200 | $142,200 |
| 2018 | $1,570 | $167,400 | $31,200 | $136,200 |
| 2017 | $1,436 | $151,800 | $30,000 | $121,800 |
| 2016 | $1,378 | $147,800 | $30,000 | $117,800 |
| 2014 | $1,242 | $134,900 | $29,400 | $105,500 |
Source: Public Records
Map
Nearby Homes
- ALWICK Plan at Trescott - Gardens
- PARKETTE Plan at Trescott - Gardens
- ALDEN Plan at Trescott - Gardens
- SHELBURN Plan at Trescott - Gardens
- MAJESTIC Plan at Trescott - Overlook
- MAJESTIC Plan at Trescott - Gardens
- BUCHANAN Plan at Trescott - Overlook
- CRESTVIEW Plan at Trescott - Gardens
- VANDERBURGH Plan at Trescott - Gardens
- AYDEN Plan at Trescott - Overlook
- VANDERBURGH Plan at Trescott - Overlook
- BELLEVILLE Plan at Trescott - Overlook
- HORIZON Plan at Trescott - Gardens
- SHELBURN Plan at Trescott - Overlook
- ALDEN Plan at Trescott - Overlook
- BELLEVILLE Plan at Trescott - Gardens
- BUCHANAN Plan at Trescott - Gardens
- BELLEVILLE II Plan at Trescott - Gardens
- BELLEVILLE II Plan at Trescott - Overlook
- ALWICK Plan at Trescott - Overlook
- 6620 Gadsen Ct
- 6624 Gadsen Ct
- 5985 Glen Haven Blvd
- 6628 Gadsen Ct
- 5980 Marco St
- 5981 Glen Haven Blvd
- 5990 Glen Haven Blvd
- 6621 Gadsen Ct
- 5986 Glen Haven Blvd
- 6625 Gadsen Ct
- 5976 Marco St
- 5977 Glen Haven Blvd
- 5982 Glen Haven Blvd
- 6629 Gadsen Ct
- 6597 Gadsen Dr
- 5978 Glen Haven Blvd
- 6633 Gadsen Ct
- 5973 Glen Haven Blvd
- 6632 Gadsen Ct
- 5987 Gadsen Dr