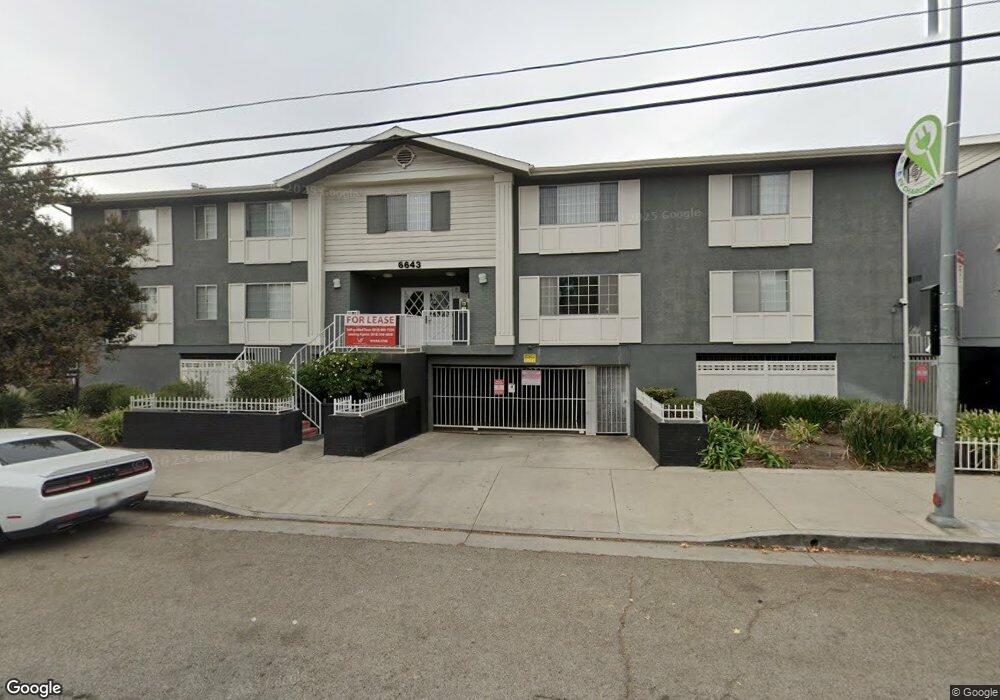
6643 Haskell Ave Van Nuys, CA 91406
3
Beds
2
Baths
1,350
Sq Ft
--
Built
About This Home
This home is located at 6643 Haskell Ave, Van Nuys, CA 91406. 6643 Haskell Ave is a home located in Los Angeles County with nearby schools including Bassett Street Elementary, William Mulholland Middle, and Birmingham Community Charter High.
Create a Home Valuation Report for This Property
The Home Valuation Report is an in-depth analysis detailing your home's value as well as a comparison with similar homes in the area
Home Values in the Area
Average Home Value in this Area
Property History
| Date | Event | Price | List to Sale | Price per Sq Ft |
|---|---|---|---|---|
| 06/24/2025 06/24/25 | Off Market | $1,998 | -- | -- |
| 06/18/2025 06/18/25 | Price Changed | $1,998 | -4.8% | $1 / Sq Ft |
| 04/29/2025 04/29/25 | Price Changed | $2,098 | -2.3% | $2 / Sq Ft |
| 04/16/2025 04/16/25 | Price Changed | $2,148 | -2.3% | $2 / Sq Ft |
| 04/11/2025 04/11/25 | Price Changed | $2,198 | +4.8% | $2 / Sq Ft |
| 04/04/2025 04/04/25 | For Rent | $2,098 | 0.0% | -- |
| 04/04/2025 04/04/25 | Off Market | $2,098 | -- | -- |
| 03/26/2025 03/26/25 | For Rent | $2,098 | 0.0% | -- |
| 03/25/2025 03/25/25 | Off Market | $2,098 | -- | -- |
| 03/18/2025 03/18/25 | For Rent | $2,098 | 0.0% | -- |
| 03/18/2025 03/18/25 | Off Market | $2,098 | -- | -- |
| 03/08/2025 03/08/25 | Price Changed | $2,098 | 0.0% | $2 / Sq Ft |
| 03/08/2025 03/08/25 | For Rent | $2,098 | -4.5% | -- |
| 03/05/2025 03/05/25 | Off Market | $2,198 | -- | -- |
| 02/08/2025 02/08/25 | Price Changed | $2,198 | -18.5% | $2 / Sq Ft |
| 02/05/2025 02/05/25 | Price Changed | $2,698 | +22.7% | $2 / Sq Ft |
| 01/17/2025 01/17/25 | For Rent | $2,198 | 0.0% | -- |
| 12/25/2024 12/25/24 | Off Market | $2,198 | -- | -- |
| 12/18/2024 12/18/24 | Price Changed | $2,198 | +10.0% | $2 / Sq Ft |
| 11/26/2024 11/26/24 | Price Changed | $1,998 | -13.1% | $1 / Sq Ft |
| 11/15/2024 11/15/24 | Price Changed | $2,298 | 0.0% | $2 / Sq Ft |
| 11/15/2024 11/15/24 | For Rent | $2,298 | -3.3% | -- |
| 09/24/2024 09/24/24 | Price Changed | $2,377 | -2.9% | $2 / Sq Ft |
| 09/20/2024 09/20/24 | For Rent | $2,448 | 0.0% | -- |
| 08/17/2024 08/17/24 | Price Changed | $2,448 | +22.5% | $2 / Sq Ft |
| 06/05/2024 06/05/24 | For Rent | $1,998 | 0.0% | -- |
| 05/22/2024 05/22/24 | Price Changed | $1,998 | 0.0% | $1 / Sq Ft |
| 05/22/2024 05/22/24 | For Rent | $1,998 | -9.1% | -- |
| 04/06/2024 04/06/24 | Price Changed | $2,198 | 0.0% | $2 / Sq Ft |
| 04/06/2024 04/06/24 | For Rent | $2,198 | +10.0% | -- |
| 12/08/2023 12/08/23 | Price Changed | $1,998 | 0.0% | $1 / Sq Ft |
| 12/08/2023 12/08/23 | For Rent | $1,998 | -16.7% | -- |
| 11/03/2023 11/03/23 | Price Changed | $2,398 | +9.1% | $2 / Sq Ft |
| 09/27/2023 09/27/23 | Price Changed | $2,198 | -4.4% | $2 / Sq Ft |
| 09/12/2023 09/12/23 | Price Changed | $2,298 | -13.2% | $2 / Sq Ft |
| 09/06/2023 09/06/23 | Price Changed | $2,648 | -1.9% | $2 / Sq Ft |
| 08/30/2023 08/30/23 | Price Changed | $2,698 | 0.0% | $2 / Sq Ft |
| 08/30/2023 08/30/23 | For Rent | $2,698 | +25.6% | -- |
| 07/12/2023 07/12/23 | Price Changed | $2,148 | -10.4% | $2 / Sq Ft |
| 07/06/2023 07/06/23 | Price Changed | $2,398 | -2.0% | $2 / Sq Ft |
| 06/28/2023 06/28/23 | Price Changed | $2,448 | -9.3% | $2 / Sq Ft |
| 06/24/2023 06/24/23 | Price Changed | $2,698 | 0.0% | $2 / Sq Ft |
| 06/24/2023 06/24/23 | For Rent | $2,698 | -3.6% | -- |
| 06/20/2023 06/20/23 | For Rent | $2,798 | 0.0% | -- |
| 05/18/2023 05/18/23 | Price Changed | $2,798 | 0.0% | $2 / Sq Ft |
| 05/18/2023 05/18/23 | For Rent | $2,798 | +12.0% | -- |
| 03/01/2023 03/01/23 | Price Changed | $2,498 | +8.7% | $2 / Sq Ft |
| 02/08/2023 02/08/23 | Price Changed | $2,298 | -8.0% | $2 / Sq Ft |
| 01/26/2023 01/26/23 | Price Changed | $2,498 | 0.0% | $2 / Sq Ft |
| 12/25/2022 12/25/22 | Price Changed | $2,498 | -5.7% | $2 / Sq Ft |
| 12/05/2022 12/05/22 | Price Changed | $2,648 | -23.2% | $2 / Sq Ft |
| 11/23/2022 11/23/22 | Price Changed | $3,448 | +23.2% | $3 / Sq Ft |
| 11/16/2022 11/16/22 | Price Changed | $2,798 | 0.0% | $2 / Sq Ft |
| 11/16/2022 11/16/22 | For Rent | $2,798 | +30.4% | -- |
| 09/21/2022 09/21/22 | Price Changed | $2,145 | -10.6% | $2 / Sq Ft |
| 09/20/2022 09/20/22 | For Rent | $2,398 | 0.0% | -- |
| 09/16/2022 09/16/22 | For Rent | $2,398 | -- | -- |
Tax History
| Year | Tax Paid | Tax Assessment Tax Assessment Total Assessment is a certain percentage of the fair market value that is determined by local assessors to be the total taxable value of land and additions on the property. | Land | Improvement |
|---|---|---|---|---|
| 2025 | $56,651 | $4,577,483 | $1,365,393 | $3,212,090 |
| 2024 | $56,651 | $4,487,729 | $1,338,621 | $3,149,108 |
| 2023 | $55,582 | $4,399,735 | $1,312,374 | $3,087,361 |
| 2022 | $53,061 | $4,313,467 | $1,286,642 | $3,026,825 |
| 2021 | $52,341 | $4,228,890 | $1,261,414 | $2,967,476 |
| 2019 | $50,811 | $4,103,460 | $1,224,000 | $2,879,460 |
| 2018 | $50,415 | $4,023,000 | $1,200,000 | $2,823,000 |
| 2016 | $29,993 | $2,351,720 | $496,263 | $1,855,457 |
| 2015 | $29,576 | $2,316,396 | $488,809 | $1,827,587 |
| 2014 | $29,777 | $2,271,022 | $479,234 | $1,791,788 |
Source: Public Records
Map
Nearby Homes
- 6551 Whitman Ave
- 6552 Aqueduct Ave
- 6631 Densmore Ave
- 6539 Blucher Ave
- 6615 Orion Ave
- 6845 Haskell Ave
- 15934 Kittridge St
- 15933 Haynes St
- 15865 Vanowen St
- 6628 Gaviota Ave
- 6819 Chisholm Ave
- 6648 Gaviota Ave
- 6849 Firmament Ave
- 15735 Bassett St
- 6616 Langdon Ave
- 15815 Bassett St
- 15445 Vanowen St
- 6747 Gaviota Ave
- 15525 Sylvan St
- 15864 Marlin Place
- 6651 Haskell Ave
- 6611 Haskell Ave
- 6701 Haskell Ave Unit 5
- 6701 Haskell Ave Unit 3
- 6701 Haskell Ave
- 6636 Whitman Ave
- 6642 Whitman Ave
- 6632 Whitman Ave
- 15712 Lemay St
- 6626 Whitman Ave
- 6652 Whitman Ave
- 6646 Whitman Ave
- 6622 Whitman Ave
- 15720 Lemay St
- 6616 Whitman Ave
- 15726 Lemay St
- 6711 Haskell Ave
- 6610 Whitman Ave
- 15715 Lemay St
- 6637 Whitman Ave
Your Personal Tour Guide
Ask me questions while you tour the home.