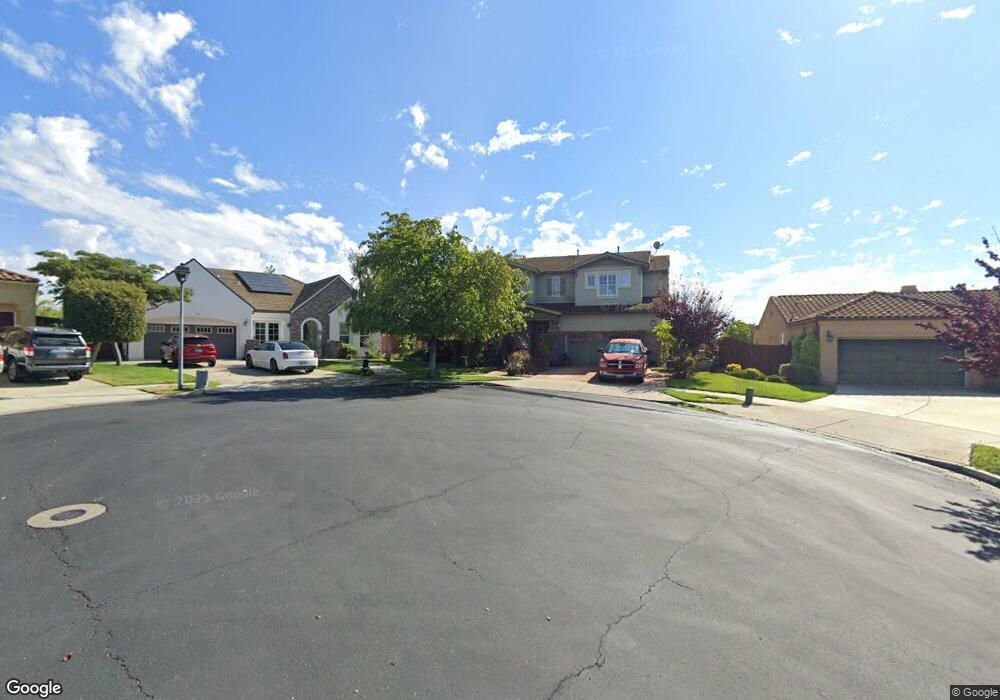
668 Celestial Way Lompoc, CA 93436
Estimated Value: $908,872 - $998,000
5
Beds
4
Baths
3,186
Sq Ft
$299/Sq Ft
Est. Value
About This Home
This home is located at 668 Celestial Way, Lompoc, CA 93436 and is currently estimated at $951,718, approximately $298 per square foot. 668 Celestial Way is a home located in Santa Barbara County with nearby schools including Buena Vista Elementary School, Cabrillo High School, and Olive Grove Charter - Lompoc.
Ownership History
Date
Name
Owned For
Owner Type
Purchase Details
Closed on
Jan 30, 2006
Sold by
Capital Pacific Holdings Llc
Bought by
Murphy John M and Murphy Linda K
Current Estimated Value
Home Financials for this Owner
Home Financials are based on the most recent Mortgage that was taken out on this home.
Original Mortgage
$74,700
Outstanding Balance
$41,953
Interest Rate
6.16%
Mortgage Type
Credit Line Revolving
Estimated Equity
$909,765
Purchase Details
Closed on
Sep 21, 2005
Sold by
Heartstone Multi Asset Entity S Lp
Bought by
Capital Pacific Holdings Llc
Create a Home Valuation Report for This Property
The Home Valuation Report is an in-depth analysis detailing your home's value as well as a comparison with similar homes in the area
Home Values in the Area
Average Home Value in this Area
Purchase History
| Date | Buyer | Sale Price | Title Company |
|---|---|---|---|
| Murphy John M | $747,500 | First American Title Company | |
| Capital Pacific Holdings Llc | -- | First American Title |
Source: Public Records
Mortgage History
| Date | Status | Borrower | Loan Amount |
|---|---|---|---|
| Open | Murphy John M | $74,700 | |
| Open | Murphy John M | $597,800 |
Source: Public Records
Tax History
| Year | Tax Paid | Tax Assessment Tax Assessment Total Assessment is a certain percentage of the fair market value that is determined by local assessors to be the total taxable value of land and additions on the property. | Land | Improvement |
|---|---|---|---|---|
| 2025 | $9,814 | $846,000 | $284,000 | $562,000 |
| 2023 | $9,814 | $731,000 | $245,000 | $486,000 |
| 2022 | $9,015 | $716,000 | $240,000 | $476,000 |
| 2021 | $8,191 | $623,000 | $209,000 | $414,000 |
| 2020 | $7,526 | $566,000 | $190,000 | $376,000 |
| 2019 | $7,549 | $566,000 | $190,000 | $376,000 |
| 2018 | $7,578 | $566,000 | $190,000 | $376,000 |
| 2017 | $7,182 | $539,000 | $181,000 | $358,000 |
| 2016 | $6,616 | $513,000 | $172,000 | $341,000 |
| 2015 | $6,108 | $466,000 | $156,000 | $310,000 |
| 2014 | $6,031 | $457,000 | $153,000 | $304,000 |
Source: Public Records
Map
Nearby Homes
- 3725 Jupiter Ave
- 731 Voyager Rd
- 3843 Cassini Cir Unit 3
- 728 Pluto Ave
- 3916 Mesa Circle Dr Unit A
- 3922 Mesa Circle Dr
- 3939 Mesa Circle Dr
- 832 Onstott Rd
- 778 Tamarisk Dr
- 972 Pellham Dr
- 250 Saint Andrews Way
- 892 Onstott Rd
- 384 Falcon Crest Dr
- 372 Falcon Crest Dr
- 232 Vega Ave
- 2655 Adobe Falls Rd
- 280 Rinconcito
- 4166 Oakwood Ct
- 4173 Oakwood Ct
- 113 Gemini Ave
Your Personal Tour Guide
Ask me questions while you tour the home.