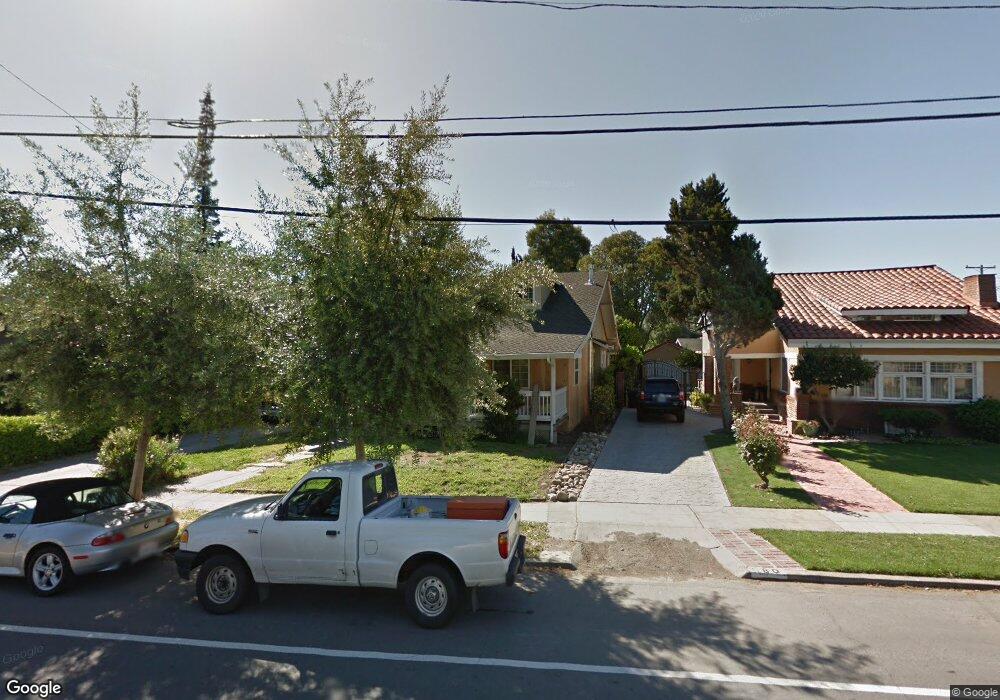
674 Coe Ave San Jose, CA 95125
Willow Glen NeighborhoodEstimated Value: $1,772,000 - $2,066,000
3
Beds
2
Baths
1,428
Sq Ft
$1,390/Sq Ft
Est. Value
About This Home
This home is located at 674 Coe Ave, San Jose, CA 95125 and is currently estimated at $1,984,257, approximately $1,389 per square foot. 674 Coe Ave is a home located in Santa Clara County with nearby schools including Willow Glen Elementary, Willow Glen Middle, and Willow Glen High School.
Ownership History
Date
Name
Owned For
Owner Type
Purchase Details
Closed on
Aug 17, 2021
Sold by
Lindsay Sian and Solis Daniel M
Bought by
Solis Daniel M and Sian Lindsay
Current Estimated Value
Home Financials for this Owner
Home Financials are based on the most recent Mortgage that was taken out on this home.
Original Mortgage
$446,000
Outstanding Balance
$404,941
Interest Rate
2.8%
Mortgage Type
New Conventional
Estimated Equity
$1,579,316
Purchase Details
Closed on
Apr 13, 2012
Sold by
Lindsay Sian and Solis Daniel M
Bought by
Lindsay Sian and Solis Daniel M
Home Financials for this Owner
Home Financials are based on the most recent Mortgage that was taken out on this home.
Original Mortgage
$566,500
Interest Rate
3.98%
Mortgage Type
New Conventional
Purchase Details
Closed on
Jan 25, 2011
Sold by
Lindsay Sian and Solis Daniel M
Bought by
Lindsay Sian and Solis Daniel M
Home Financials for this Owner
Home Financials are based on the most recent Mortgage that was taken out on this home.
Original Mortgage
$50,000
Interest Rate
4.79%
Mortgage Type
Credit Line Revolving
Purchase Details
Closed on
Mar 9, 2010
Sold by
Litton Loan Servicing Lp
Bought by
Lindsay Sian and Solis Dan M
Home Financials for this Owner
Home Financials are based on the most recent Mortgage that was taken out on this home.
Original Mortgage
$572,000
Interest Rate
4.94%
Mortgage Type
New Conventional
Purchase Details
Closed on
Oct 7, 2009
Sold by
Tollick Dawn E and Tollick Char
Bought by
Litton Loan Servicing Lp
Purchase Details
Closed on
Feb 23, 2007
Sold by
Tollick Dawn E and Tollick Char
Bought by
Tollick Char and Tollick Dawn E
Home Financials for this Owner
Home Financials are based on the most recent Mortgage that was taken out on this home.
Original Mortgage
$149,000
Interest Rate
6.29%
Mortgage Type
Stand Alone Second
Purchase Details
Closed on
Jan 6, 2006
Sold by
Bond Kent and Hannon Mary Ellen
Bought by
Tollick Char and Tollick Dawn E
Home Financials for this Owner
Home Financials are based on the most recent Mortgage that was taken out on this home.
Original Mortgage
$181,400
Interest Rate
6.32%
Mortgage Type
Stand Alone Second
Purchase Details
Closed on
Jun 14, 2002
Sold by
Green Garry L and Green Leah R
Bought by
Bond Kent and Hannon Mary Ellen
Home Financials for this Owner
Home Financials are based on the most recent Mortgage that was taken out on this home.
Original Mortgage
$517,300
Interest Rate
6.74%
Create a Home Valuation Report for This Property
The Home Valuation Report is an in-depth analysis detailing your home's value as well as a comparison with similar homes in the area
Home Values in the Area
Average Home Value in this Area
Purchase History
| Date | Buyer | Sale Price | Title Company |
|---|---|---|---|
| Solis Daniel M | -- | Chicago Title Company | |
| Lindsay Sian | -- | Chicago Title Company | |
| Lindsay Sian | -- | Chicago Title Company | |
| Lindsay Sian | $715,000 | First American Title Company | |
| Litton Loan Servicing Lp | $725,000 | Accommodation | |
| Tollick Char | -- | Chicago Title Company | |
| Tollick Char | $907,000 | None Available | |
| Bond Kent | $739,000 | North American Title Co |
Source: Public Records
Mortgage History
| Date | Status | Borrower | Loan Amount |
|---|---|---|---|
| Open | Solis Daniel M | $446,000 | |
| Closed | Lindsay Sian | $566,500 | |
| Closed | Lindsay Sian | $50,000 | |
| Closed | Lindsay Sian | $572,000 | |
| Previous Owner | Tollick Char | $149,000 | |
| Previous Owner | Tollick Char | $816,000 | |
| Previous Owner | Tollick Char | $181,400 | |
| Previous Owner | Tollick Char | $725,600 | |
| Previous Owner | Bond Kent | $517,300 |
Source: Public Records
Tax History Compared to Growth
Tax History
| Year | Tax Paid | Tax Assessment Tax Assessment Total Assessment is a certain percentage of the fair market value that is determined by local assessors to be the total taxable value of land and additions on the property. | Land | Improvement |
|---|---|---|---|---|
| 2025 | $13,241 | $1,074,907 | $516,324 | $558,583 |
| 2024 | $13,241 | $1,053,831 | $506,200 | $547,631 |
| 2023 | $13,610 | $1,033,169 | $496,275 | $536,894 |
| 2022 | $13,414 | $1,012,912 | $486,545 | $526,367 |
| 2021 | $13,133 | $993,052 | $477,005 | $516,047 |
| 2020 | $12,846 | $982,870 | $472,114 | $510,756 |
| 2019 | $12,572 | $963,599 | $462,857 | $500,742 |
| 2018 | $12,447 | $944,706 | $453,782 | $490,924 |
| 2017 | $12,344 | $926,184 | $444,885 | $481,299 |
| 2016 | $12,138 | $908,024 | $436,162 | $471,862 |
| 2015 | $10,694 | $783,406 | $429,611 | $353,795 |
| 2014 | $10,154 | $768,061 | $421,196 | $346,865 |
Source: Public Records
Map
Nearby Homes
- 747 Coe Ave
- 943 Riverside Dr
- 546 Coe Ave
- 935 Chabrant Way
- 1044 Lincoln Ave
- 1087 Merle Ave
- 1025 Delmas Ave
- 715 Harrison St
- 1133 Garfield Ave
- 1124 Delmas Ave
- 841 Willis Ave
- 470 Jerome St
- 408 Fuller Ave
- 986 Spencer Ave
- 975 Prevost St
- 108 Glen Eyrie Ave
- 502 Hannah St
- 1206 Clark St
- 1275 Bird Ave
- 1265 Blewett Ave