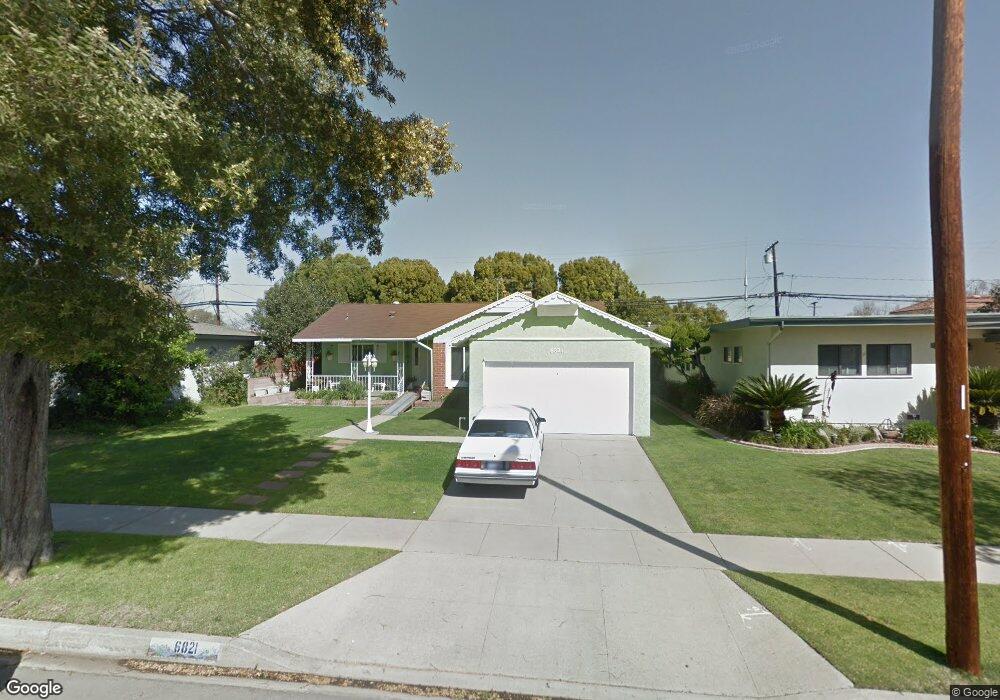
6821 E Monlaco Rd Long Beach, CA 90808
Plaza NeighborhoodEstimated Value: $1,119,840 - $1,308,000
4
Beds
2
Baths
1,655
Sq Ft
$728/Sq Ft
Est. Value
About This Home
This home is located at 6821 E Monlaco Rd, Long Beach, CA 90808 and is currently estimated at $1,204,210, approximately $727 per square foot. 6821 E Monlaco Rd is a home located in Los Angeles County with nearby schools including Cubberley K-8, Millikan High School, and St. Maria Goretti Catholic School.
Ownership History
Date
Name
Owned For
Owner Type
Purchase Details
Closed on
May 5, 2021
Sold by
Roshanaei Alireza and Roshanaei Jacinda
Bought by
Pich Jacinda
Current Estimated Value
Purchase Details
Closed on
Oct 22, 2020
Sold by
Roshanaei Alireza
Bought by
Roshanaei Alireza and Pich Jacinda
Home Financials for this Owner
Home Financials are based on the most recent Mortgage that was taken out on this home.
Original Mortgage
$297,600
Interest Rate
2.3%
Mortgage Type
New Conventional
Purchase Details
Closed on
Aug 8, 2011
Sold by
Campbell Douglas R and The Campbell Family Living Tru
Bought by
Roshanaei Alireza
Home Financials for this Owner
Home Financials are based on the most recent Mortgage that was taken out on this home.
Original Mortgage
$354,000
Interest Rate
4.37%
Mortgage Type
New Conventional
Create a Home Valuation Report for This Property
The Home Valuation Report is an in-depth analysis detailing your home's value as well as a comparison with similar homes in the area
Home Values in the Area
Average Home Value in this Area
Purchase History
| Date | Buyer | Sale Price | Title Company |
|---|---|---|---|
| Pich Jacinda | -- | None Listed On Document | |
| Roshanaei Alireza | -- | American Coast Title | |
| Roshanaei Alireza | $443,000 | Pacific Coast Title Company |
Source: Public Records
Mortgage History
| Date | Status | Borrower | Loan Amount |
|---|---|---|---|
| Previous Owner | Roshanaei Alireza | $297,600 | |
| Previous Owner | Roshanaei Alireza | $354,000 |
Source: Public Records
Tax History
| Year | Tax Paid | Tax Assessment Tax Assessment Total Assessment is a certain percentage of the fair market value that is determined by local assessors to be the total taxable value of land and additions on the property. | Land | Improvement |
|---|---|---|---|---|
| 2025 | $7,334 | $565,513 | $435,218 | $130,295 |
| 2024 | $7,334 | $554,426 | $426,685 | $127,741 |
| 2023 | $7,213 | $543,556 | $418,319 | $125,237 |
| 2022 | $6,771 | $532,899 | $410,117 | $122,782 |
| 2021 | $6,636 | $522,451 | $402,076 | $120,375 |
| 2020 | $6,616 | $517,095 | $397,954 | $119,141 |
| 2019 | $6,540 | $506,956 | $390,151 | $116,805 |
| 2018 | $6,219 | $488,585 | $382,501 | $106,084 |
| 2016 | $5,766 | $469,614 | $367,649 | $101,965 |
| 2015 | $5,486 | $462,561 | $362,127 | $100,434 |
| 2014 | $5,447 | $453,501 | $355,034 | $98,467 |
Source: Public Records
Map
Nearby Homes
- 6829 E Parapet St
- 3502 Monogram Ave
- 3702 N Studebaker Rd
- 3516 Roxanne Ave
- 6721 E Coralite St
- 3426 Roxanne Ave
- 3509 Volk Ave
- 3903 N Studebaker Rd
- 3458 Stevely Ave
- 3675 Palo Verde Ave
- 3635 Conquista Ave
- 3202 N Studebaker Rd
- 3973 Knoxville Ave
- 7213 E Lanai St
- 6128 E Conant St
- 3108 Petaluma Ave
- 3114 Hackett Ave
- 7020 Schroll St
- 3816 Snowden Ave
- 7080 Schroll St
- 6815 E Monlaco Rd
- 6827 E Monlaco Rd
- 6816 E Keynote St
- 6822 E Keynote St
- 6809 E Monlaco Rd
- 6812 E Keynote St
- 6833 E Monlaco Rd
- 6828 E Keynote St
- 6808 E Keynote St
- 6820 E Monlaco Rd
- 6814 E Monlaco Rd
- 6826 E Monlaco Rd
- 6832 E Keynote St
- 6803 E Monlaco Rd
- 6839 E Monlaco Rd
- 6802 E Keynote St
- 6808 E Monlaco Rd
- 6832 E Monlaco Rd
- 6838 E Keynote St
- 6802 E Monlaco Rd
Your Personal Tour Guide
Ask me questions while you tour the home.