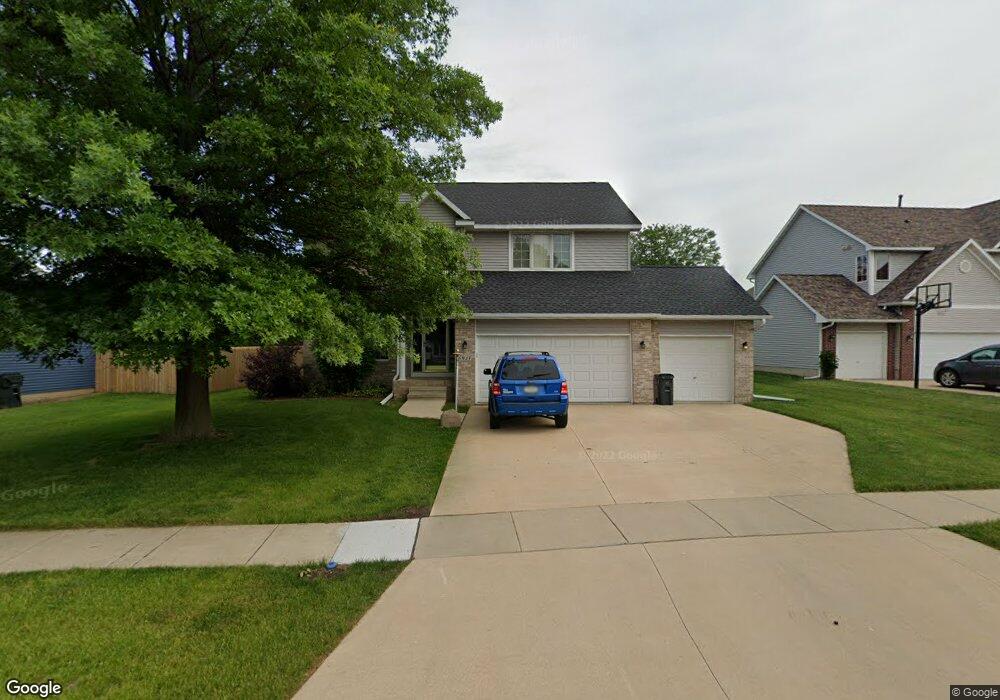
6927 E Park Rd NE Cedar Rapids, IA 52402
Estimated Value: $341,735 - $361,000
4
Beds
4
Baths
2,356
Sq Ft
$149/Sq Ft
Est. Value
About This Home
This home is located at 6927 E Park Rd NE, Cedar Rapids, IA 52402 and is currently estimated at $349,934, approximately $148 per square foot. 6927 E Park Rd NE is a home located in Linn County with nearby schools including Westfield Elementary School, Oak Ridge School, and Linn-Mar High School.
Ownership History
Date
Name
Owned For
Owner Type
Purchase Details
Closed on
Dec 14, 2001
Sold by
Stepanek James F and Stepanek Peggy A
Bought by
Dewit Timothy J and Dewit Merri Lea
Current Estimated Value
Home Financials for this Owner
Home Financials are based on the most recent Mortgage that was taken out on this home.
Original Mortgage
$173,600
Outstanding Balance
$67,986
Interest Rate
6.6%
Estimated Equity
$281,948
Purchase Details
Closed on
Jul 15, 1999
Sold by
Boyson Park Associates
Bought by
Regency Land Company Lc
Home Financials for this Owner
Home Financials are based on the most recent Mortgage that was taken out on this home.
Original Mortgage
$179,250
Interest Rate
7.43%
Purchase Details
Closed on
Jul 6, 1999
Sold by
Regency Builders Of Eastern Iowa Lc
Bought by
Stepanek James F and Stepanek Peggy A
Home Financials for this Owner
Home Financials are based on the most recent Mortgage that was taken out on this home.
Original Mortgage
$179,250
Interest Rate
7.43%
Create a Home Valuation Report for This Property
The Home Valuation Report is an in-depth analysis detailing your home's value as well as a comparison with similar homes in the area
Home Values in the Area
Average Home Value in this Area
Purchase History
| Date | Buyer | Sale Price | Title Company |
|---|---|---|---|
| Dewit Timothy J | $216,500 | -- | |
| Regency Land Company Lc | $9,500 | -- | |
| Stepanek James F | $210,500 | -- | |
| Regency Builders Of Eastern Iowa Lc | -- | -- |
Source: Public Records
Mortgage History
| Date | Status | Borrower | Loan Amount |
|---|---|---|---|
| Open | Dewit Timothy J | $173,600 | |
| Previous Owner | Stepanek James F | $179,250 |
Source: Public Records
Tax History Compared to Growth
Tax History
| Year | Tax Paid | Tax Assessment Tax Assessment Total Assessment is a certain percentage of the fair market value that is determined by local assessors to be the total taxable value of land and additions on the property. | Land | Improvement |
|---|---|---|---|---|
| 2025 | $5,502 | $311,100 | $71,400 | $239,700 |
| 2024 | $5,662 | $302,400 | $71,400 | $231,000 |
| 2023 | $5,662 | $291,300 | $63,000 | $228,300 |
| 2022 | $5,338 | $256,600 | $56,700 | $199,900 |
| 2021 | $5,368 | $250,100 | $52,500 | $197,600 |
| 2020 | $5,368 | $237,200 | $48,300 | $188,900 |
| 2019 | $5,066 | $233,000 | $44,100 | $188,900 |
| 2018 | $4,846 | $226,600 | $44,100 | $182,500 |
| 2017 | $5,014 | $227,300 | $44,100 | $183,200 |
| 2016 | $4,857 | $217,100 | $44,100 | $173,000 |
| 2015 | $5,235 | $233,810 | $33,589 | $200,221 |
| 2014 | $5,040 | $233,810 | $33,589 | $200,221 |
| 2013 | $4,868 | $233,810 | $33,589 | $200,221 |
Source: Public Records
Map
Nearby Homes
- 7104 Doubletree Rd NE
- 1055 74th St NE Unit 1055
- 1167 74th St NE Unit 1167
- 1008 Doubletree Ct NE Unit 1008
- 1233 Crescent View Dr NE
- 7128 Summerland Ridge Rd NE
- 1229 Honey Creek Way NE
- 1215 Prairieview Dr NE
- 1019 Acacia Dr NE
- 4599 Summerset Ave NE
- 913 Deer Run Dr NE
- 7701 Westfield Dr NE
- 1018 Deer Run Dr NE
- 6715 Creekside Dr NE Unit 5
- 6715 Creekside Dr NE Unit 2
- 634 White Ivy Place NE
- 7599 Summerset Ave NE
- 1407 Tower Ln NE Unit 1407
- 1200 Murray St NE Unit 11
- 1127 Tiara Dr NE
- 6919 E Park Rd NE
- 7007 E Park Rd NE
- 7015 E Park Rd NE
- 907 Chesterfield Rd NE
- 6911 E Park Rd NE
- 917 Chesterfield Rd NE
- 7021 E Park Rd NE
- 923 Chesterfield Rd NE
- 6924 E Park Rd NE
- 6930 E Park Rd NE
- 6918 E Park Rd NE
- 6903 E Park Rd NE
- 6936 E Park Rd NE
- 6912 E Park Rd NE
- 7004 E Park Rd NE
- 1001 Chesterfield Rd NE
- 7010 E Park Rd NE
- 7100 E Park Rd NE
- 6906 E Park Rd NE
- 7102 E Park Rd NE