Estimated Value: $394,000 - $629,000
4
Beds
3
Baths
2,755
Sq Ft
$178/Sq Ft
Est. Value
About This Home
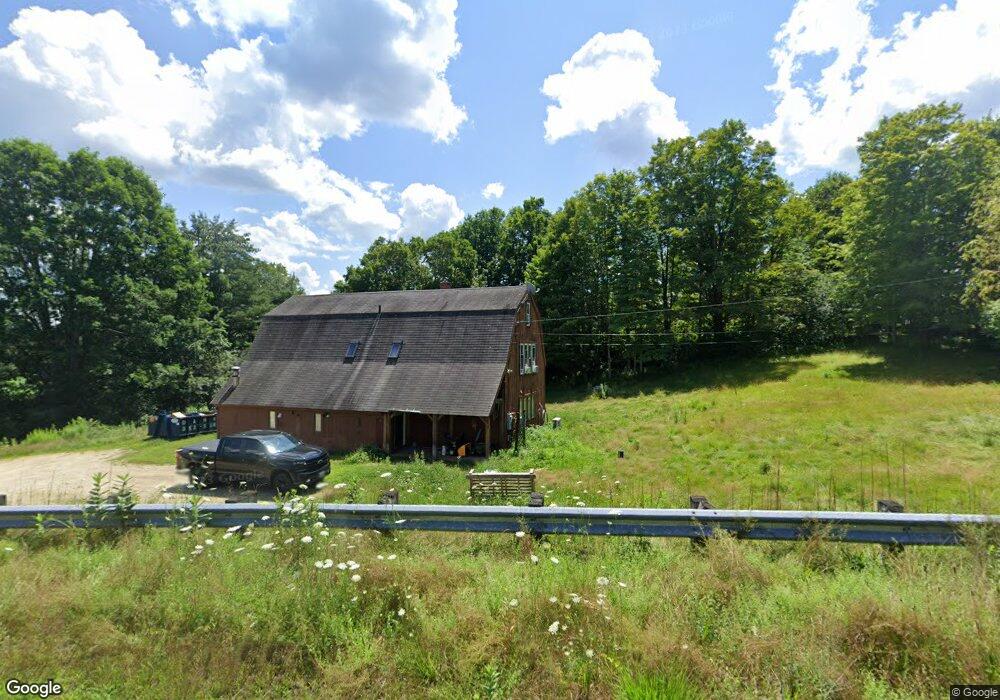
This home is located at 7 Black Brook Rd, Keene, NH 03431 and is currently estimated at $490,951, approximately $178 per square foot. 7 Black Brook Rd is a home with nearby schools including Keene Middle School, Keene High School, and Gathering Waters Charter School (H).
Ownership History
Date
Name
Owned For
Owner Type
Purchase Details
Closed on
Apr 5, 2019
Sold by
Jeanna C Hamblet Ret
Bought by
Burge Joy
Current Estimated Value
Home Financials for this Owner
Home Financials are based on the most recent Mortgage that was taken out on this home.
Original Mortgage
$238,598
Outstanding Balance
$207,413
Interest Rate
3.76%
Mortgage Type
FHA
Estimated Equity
$283,538
Purchase Details
Closed on
Jun 20, 2002
Sold by
Igenics Inc
Bought by
Hamblet Philip M Jeanna
Home Financials for this Owner
Home Financials are based on the most recent Mortgage that was taken out on this home.
Original Mortgage
$116,200
Interest Rate
6.81%
Purchase Details
Closed on
Apr 2, 2001
Sold by
Monadnock Economic Dev
Bought by
Ingenis Inc
Home Financials for this Owner
Home Financials are based on the most recent Mortgage that was taken out on this home.
Original Mortgage
$74,800
Interest Rate
6.96%
Create a Home Valuation Report for This Property
The Home Valuation Report is an in-depth analysis detailing your home's value as well as a comparison with similar homes in the area
Home Values in the Area
Average Home Value in this Area
Purchase History
| Date | Buyer | Sale Price | Title Company |
|---|---|---|---|
| Burge Joy | $243,066 | -- | |
| Hamblet Philip M Jeanna | $155,000 | -- | |
| Ingenis Inc | $88,000 | -- |
Source: Public Records
Mortgage History
| Date | Status | Borrower | Loan Amount |
|---|---|---|---|
| Open | Burge Joy | $238,598 | |
| Previous Owner | Ingenis Inc | $116,200 | |
| Previous Owner | Ingenis Inc | $74,800 |
Source: Public Records
Tax History Compared to Growth
Tax History
| Year | Tax Paid | Tax Assessment Tax Assessment Total Assessment is a certain percentage of the fair market value that is determined by local assessors to be the total taxable value of land and additions on the property. | Land | Improvement |
|---|---|---|---|---|
| 2024 | $9,402 | $284,300 | $60,500 | $223,800 |
| 2023 | $9,066 | $284,300 | $60,500 | $223,800 |
| 2022 | $8,822 | $284,300 | $60,500 | $223,800 |
| 2021 | $8,893 | $284,300 | $60,500 | $223,800 |
| 2020 | $8,511 | $228,300 | $48,000 | $180,300 |
| 2019 | $8,584 | $228,300 | $48,000 | $180,300 |
| 2018 | $8,474 | $228,300 | $48,000 | $180,300 |
| 2017 | $8,497 | $228,300 | $48,000 | $180,300 |
| 2016 | $8,308 | $228,300 | $48,000 | $180,300 |
| 2015 | $8,090 | $235,100 | $49,900 | $185,200 |
Source: Public Records
Map
Nearby Homes
- 81 Summit Ridge Dr
- 31 American Ave
- 184 Kennedy Dr
- 10 Sugar Maple Ln Unit 10
- 32a Stonehouse Ln
- 116 Old Walpole Rd
- 36 Kennedy Dr
- 64 Old Walpole Rd
- 38 Stonehouse Ln Unit A
- 224 Darling Rd
- 8 Phoebe Ct
- 10 Phoebe Ct
- 0 Rd Unit 5039440
- 17 Leahy Rd
- 31 Darling Ct
- 87 Sparrow St
- 31 Wilbur Rd
- 101 Arch St
- 110 E Surry Rd
- 168 Arch St
- 47 Wyman Rd
- 63 Wyman Rd
- 31 Wyman Rd
- LOT4 Black Brook Rd
- LOT 4 Black Brook Rd
- 44 Black Brook Rd
- - Black Brook Rd
- 0 Black Brook Rd
- 344 Summit Rd
- 340 Summit Rd
- 55 Black Brook Rd
- 0 Wyman Rd
- 300 Summit Rd
- 28 Forge St
- 28 Forge St Unit 6
- 25 Forge St
- 25 Forge St Unit A
- 25 Forge St Unit B
- 278 Summit Rd
- 432 Route 12