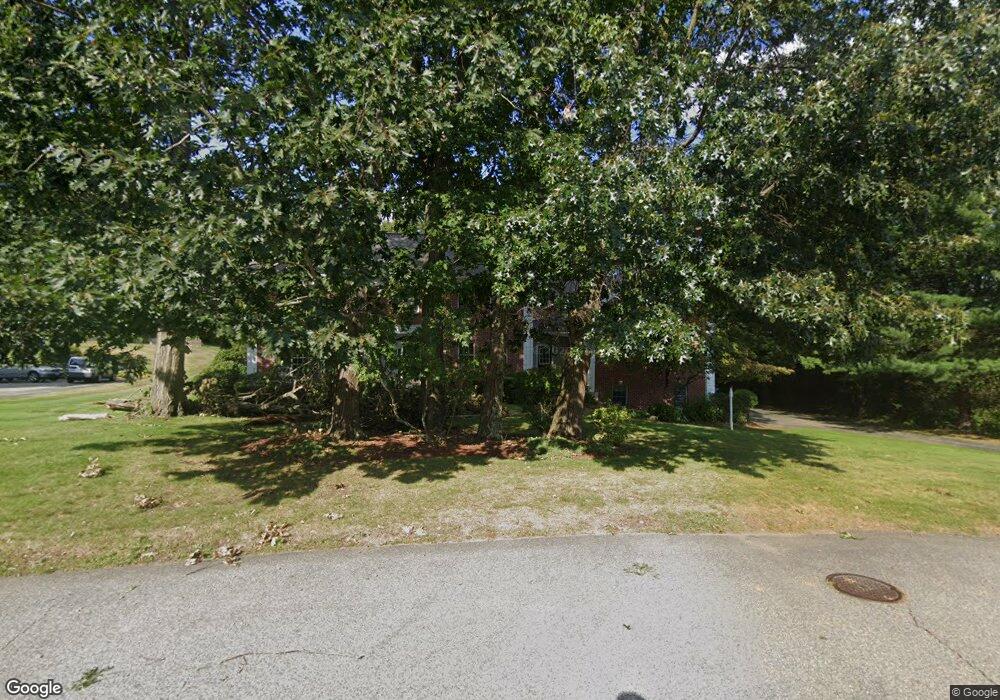
7 Durham Dr Andover, MA 01810
West Andover NeighborhoodEstimated Value: $1,337,000 - $1,621,000
4
Beds
5
Baths
4,249
Sq Ft
$359/Sq Ft
Est. Value
About This Home
This home is located at 7 Durham Dr, Andover, MA 01810 and is currently estimated at $1,524,865, approximately $358 per square foot. 7 Durham Dr is a home located in Essex County with nearby schools including Henry C. Sanborn Elementary School, Andover West Middle School, and Andover High School.
Ownership History
Date
Name
Owned For
Owner Type
Purchase Details
Closed on
Aug 30, 1996
Sold by
Cjd Rt
Bought by
Wall William P
Current Estimated Value
Home Financials for this Owner
Home Financials are based on the most recent Mortgage that was taken out on this home.
Original Mortgage
$207,000
Interest Rate
8.18%
Mortgage Type
Purchase Money Mortgage
Create a Home Valuation Report for This Property
The Home Valuation Report is an in-depth analysis detailing your home's value as well as a comparison with similar homes in the area
Home Values in the Area
Average Home Value in this Area
Purchase History
| Date | Buyer | Sale Price | Title Company |
|---|---|---|---|
| Wall William P | $261,000 | -- | |
| Wall William P | $261,000 | -- |
Source: Public Records
Mortgage History
| Date | Status | Borrower | Loan Amount |
|---|---|---|---|
| Open | Wall William P | $165,000 | |
| Closed | Wall William P | $175,000 | |
| Closed | Wall William P | $207,000 |
Source: Public Records
Tax History
| Year | Tax Paid | Tax Assessment Tax Assessment Total Assessment is a certain percentage of the fair market value that is determined by local assessors to be the total taxable value of land and additions on the property. | Land | Improvement |
|---|---|---|---|---|
| 2024 | $18,252 | $1,417,100 | $647,000 | $770,100 |
| 2023 | $17,244 | $1,262,400 | $553,000 | $709,400 |
| 2022 | $16,527 | $1,132,000 | $498,200 | $633,800 |
| 2021 | $15,891 | $1,039,300 | $453,000 | $586,300 |
| 2020 | $15,459 | $1,029,900 | $453,000 | $576,900 |
| 2019 | $15,117 | $990,000 | $422,200 | $567,800 |
| 2018 | $14,625 | $935,100 | $409,800 | $525,300 |
| 2017 | $14,049 | $925,500 | $401,800 | $523,700 |
| 2016 | $13,760 | $928,500 | $401,800 | $526,700 |
| 2015 | $13,472 | $899,900 | $401,800 | $498,100 |
Source: Public Records
Map
Nearby Homes
- 1 Delisio Dr
- 11 Rennie Dr
- 18 Dale St Unit 9D
- 2 Garfield Ln W
- 72 Tewksbury St
- 6 Hearthstone Place
- 105 Central St
- 241 Lowell St Unit 3
- 3 West Hollow
- 14 Jill's Way Unit 14
- 3 Torr St
- 31 Porter Rd
- 11 Wyncrest Cir
- 6 Exeter Way
- 4 Hammond Way
- 14 Geneva Rd
- 15 Geneva Rd
- 8 Stouffer Cir
- 58 Blanchard St
- 16 Porter Rd
Your Personal Tour Guide
Ask me questions while you tour the home.