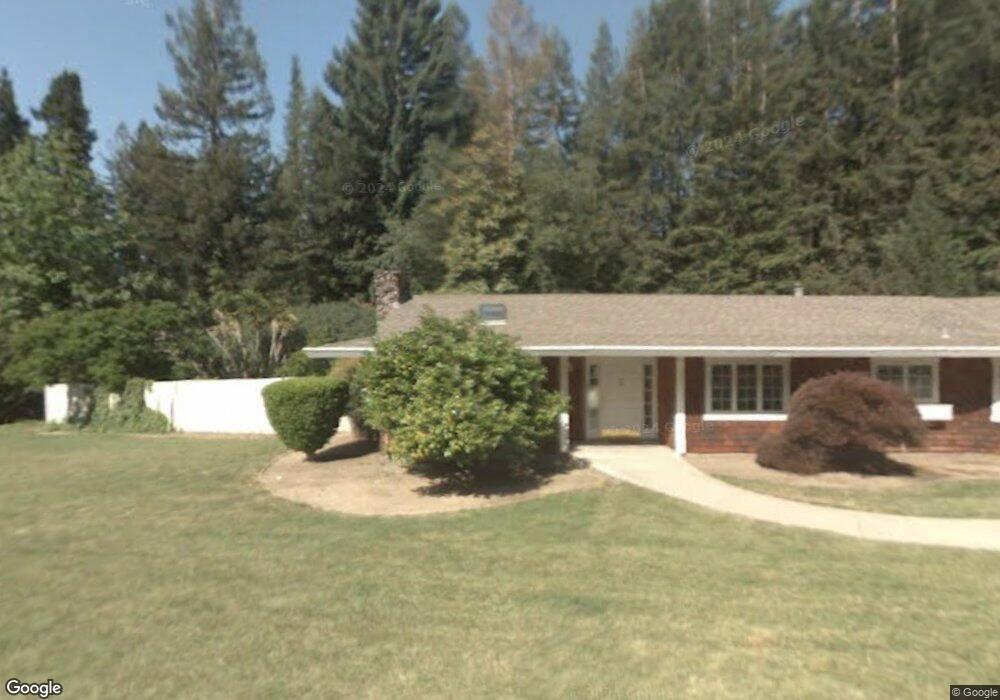
7 Redwood Cir Lafayette, CA 94549
Happy Valley NeighborhoodEstimated Value: $4,048,000 - $5,821,000
6
Beds
5
Baths
5,267
Sq Ft
$931/Sq Ft
Est. Value
About This Home
This home is located at 7 Redwood Cir, Lafayette, CA 94549 and is currently estimated at $4,903,840, approximately $931 per square foot. 7 Redwood Cir is a home located in Contra Costa County with nearby schools including Happy Valley Elementary School, M.H. Stanley Middle School, and Acalanes High School.
Ownership History
Date
Name
Owned For
Owner Type
Purchase Details
Closed on
Oct 5, 2023
Sold by
Rhodes Gregory A and Rhodes Sally Davis
Bought by
Rhodes-Davis 2003 Revocable Trust and Rhodes
Current Estimated Value
Purchase Details
Closed on
Jun 5, 2013
Sold by
Rhodes Gregory A and Rhodes Sally D
Bought by
Rhodes Gregory A and Rhodes Sally D
Home Financials for this Owner
Home Financials are based on the most recent Mortgage that was taken out on this home.
Original Mortgage
$691,000
Interest Rate
3.37%
Mortgage Type
New Conventional
Purchase Details
Closed on
Nov 26, 2002
Sold by
Rhodes Gregory A and Rhodes Sally L
Bought by
Rhodes Gregory A and Rhodes Sally L
Home Financials for this Owner
Home Financials are based on the most recent Mortgage that was taken out on this home.
Original Mortgage
$773,500
Interest Rate
6.06%
Mortgage Type
Purchase Money Mortgage
Create a Home Valuation Report for This Property
The Home Valuation Report is an in-depth analysis detailing your home's value as well as a comparison with similar homes in the area
Home Values in the Area
Average Home Value in this Area
Purchase History
| Date | Buyer | Sale Price | Title Company |
|---|---|---|---|
| Rhodes-Davis 2003 Revocable Trust | -- | None Listed On Document | |
| Rhodes Gregory A | -- | Pacific Coast Title Company | |
| Rhodes Gregory A | -- | Placer Title |
Source: Public Records
Mortgage History
| Date | Status | Borrower | Loan Amount |
|---|---|---|---|
| Previous Owner | Rhodes Gregory A | $691,000 | |
| Previous Owner | Rhodes Gregory A | $773,500 |
Source: Public Records
Tax History Compared to Growth
Tax History
| Year | Tax Paid | Tax Assessment Tax Assessment Total Assessment is a certain percentage of the fair market value that is determined by local assessors to be the total taxable value of land and additions on the property. | Land | Improvement |
|---|---|---|---|---|
| 2025 | $26,913 | $2,329,503 | $901,884 | $1,427,619 |
| 2024 | $26,456 | $2,283,827 | $884,200 | $1,399,627 |
| 2023 | $26,456 | $2,239,047 | $866,863 | $1,372,184 |
| 2022 | $26,053 | $2,195,145 | $849,866 | $1,345,279 |
| 2021 | $25,299 | $2,152,103 | $833,202 | $1,318,901 |
| 2019 | $24,882 | $2,088,273 | $808,490 | $1,279,783 |
| 2018 | $24,003 | $2,047,328 | $792,638 | $1,254,690 |
| 2017 | $23,591 | $2,007,186 | $777,097 | $1,230,089 |
| 2016 | $23,172 | $1,967,830 | $761,860 | $1,205,970 |
| 2015 | $22,550 | $1,938,273 | $750,417 | $1,187,856 |
| 2014 | $22,372 | $1,900,306 | $735,718 | $1,164,588 |
Source: Public Records
Map
Nearby Homes
- 1257 Panorama Dr
- 1275 Panorama Dr
- 1149 Camino Vallecito
- 1104 Via Roble
- 3949 Canyon Rd
- 27 Toledo Dr
- 1093 Via Roble
- 3803 Quail Ridge Rd
- 3938 Los Arabis Dr
- 4120 Happy Valley Rd
- 4146 Canyon Rd
- 1133 Estates Dr
- 3894 El Nido Ranch Rd
- 4500 Canyon Rd
- 0 Monticello Rd
- 147 Camellia Ln
- 1240 Monticello Rd
- 1109 N Thompson Rd
- 3742 Mount Diablo Blvd Unit Woodhaven 2a
- 70 Woodbury Highlands Place Unit 24
- 1261 Redwood Ln
- 1265 Redwood Ln
- 1259 Redwood Ln
- 9 Redwood Cir
- 3898 Happy Valley Rd
- 16 Deer Trail
- 11 Redwood Cir
- 1269 Redwood Ln
- 1264 Redwood Ln
- 28 Deer Trail
- 1262 Redwood Ln
- 3900 Happy Valley Rd
- 1268 Redwood Ln
- 3884 Happy Valley Rd
- 25 Deer Trail
- 9999 Happy Valley Rd
- 3868 Happy Valley Rd
- 3920 Happy Valley Rd
- 1261 Panorama Dr
- 3893 Happy Valley Rd