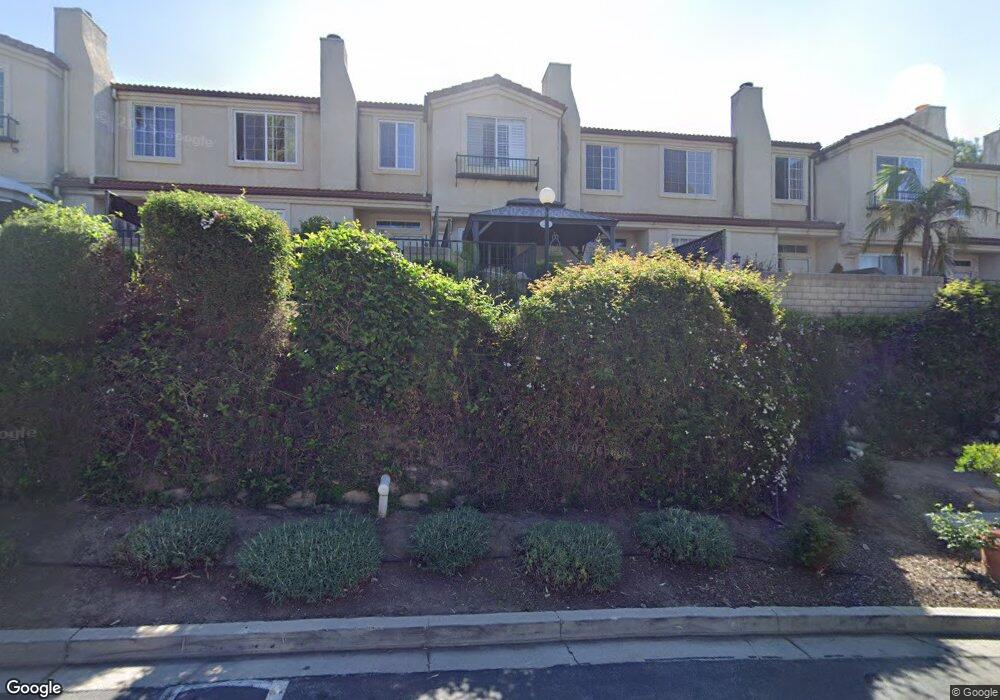
714 Seneca St Unit 4 Ventura, CA 93001
Westside NeighborhoodEstimated Value: $626,984 - $656,000
4
Beds
3
Baths
1,593
Sq Ft
$403/Sq Ft
Est. Value
About This Home
This home is located at 714 Seneca St Unit 4, Ventura, CA 93001 and is currently estimated at $641,746, approximately $402 per square foot. 714 Seneca St Unit 4 is a home located in Ventura County with nearby schools including E.P. Foster Elementary School, De Anza Academy Of Technology And The Arts, and Ventura High School.
Ownership History
Date
Name
Owned For
Owner Type
Purchase Details
Closed on
Apr 26, 2016
Sold by
Warren Vicki L
Bought by
Warren Vicki L
Current Estimated Value
Purchase Details
Closed on
Mar 16, 2000
Sold by
Carbone Vickie and Suzanne Fish J
Bought by
Warren Vicki L
Home Financials for this Owner
Home Financials are based on the most recent Mortgage that was taken out on this home.
Original Mortgage
$203,700
Outstanding Balance
$68,788
Interest Rate
8.24%
Mortgage Type
FHA
Estimated Equity
$572,958
Purchase Details
Closed on
Jun 17, 1999
Sold by
Seneca Gardens Limited
Bought by
Carbone Vickie and Suzanne Fish J
Home Financials for this Owner
Home Financials are based on the most recent Mortgage that was taken out on this home.
Original Mortgage
$170,905
Interest Rate
7.4%
Mortgage Type
FHA
Create a Home Valuation Report for This Property
The Home Valuation Report is an in-depth analysis detailing your home's value as well as a comparison with similar homes in the area
Home Values in the Area
Average Home Value in this Area
Purchase History
| Date | Buyer | Sale Price | Title Company |
|---|---|---|---|
| Warren Vicki L | -- | None Available | |
| Warren Vicki L | $210,000 | Gateway Title Company | |
| Carbone Vickie | $180,000 | Chicago Title Co |
Source: Public Records
Mortgage History
| Date | Status | Borrower | Loan Amount |
|---|---|---|---|
| Open | Warren Vicki L | $203,700 | |
| Previous Owner | Carbone Vickie | $170,905 | |
| Closed | Warren Vicki L | $10,500 |
Source: Public Records
Tax History Compared to Growth
Tax History
| Year | Tax Paid | Tax Assessment Tax Assessment Total Assessment is a certain percentage of the fair market value that is determined by local assessors to be the total taxable value of land and additions on the property. | Land | Improvement |
|---|---|---|---|---|
| 2025 | $3,448 | $322,736 | $129,094 | $193,642 |
| 2024 | $3,448 | $316,408 | $126,562 | $189,846 |
| 2023 | $3,406 | $310,204 | $124,080 | $186,124 |
| 2022 | $3,172 | $304,122 | $121,647 | $182,475 |
| 2021 | $3,110 | $298,159 | $119,261 | $178,898 |
| 2020 | $3,080 | $295,103 | $118,039 | $177,064 |
| 2019 | $3,022 | $289,318 | $115,725 | $173,593 |
| 2018 | $2,971 | $283,646 | $113,456 | $170,190 |
| 2017 | $2,907 | $278,085 | $111,232 | $166,853 |
| 2016 | $2,850 | $272,633 | $109,051 | $163,582 |
| 2015 | $2,819 | $268,540 | $107,414 | $161,126 |
| 2014 | $2,771 | $263,282 | $105,311 | $157,971 |
Source: Public Records
Map
Nearby Homes
- 771 Seneca St Unit D48
- 556 Arapaho St
- 361 Ute Ln
- 2328 Eskimo Ln
- 320 Seneca St
- 256 Blackfoot Ln
- 2321 Pima Ln
- 2346 Mohican Ln
- 343 Delaware Dr
- 2438 Kipana Ave
- 2410 Kipana Ave
- 51 W Shoshone St
- 103 Comstock Dr
- 253 Leighton Dr
- 334 Potawatome St
- 2316 Kehala Ave
- 47 W Mcfarlane Dr
- 925 Vallecito Dr
- 440 Mariposa Dr
- 398 Aliso St
- 710 Seneca St
- 718 Seneca St
- 706 Seneca St Unit 2
- 722 Seneca St Unit 6
- 702 Seneca St
- 726 Seneca St
- 713 Nocumi St
- 717 Nocumi St Unit 10
- 709 Nocumi St Unit 12
- 721 Nocumi St
- 725 Nocumi St Unit 8
- 701 Nocumi St
- 707 A1 Seneca St Unit A1
- 2399 Katari St
- 2385 Katari St Unit 45
- 2385 Katari St
- 707 Seneca St Unit 5
- 707 Seneca St Unit A2
- 707 Seneca St
- 707 Seneca St