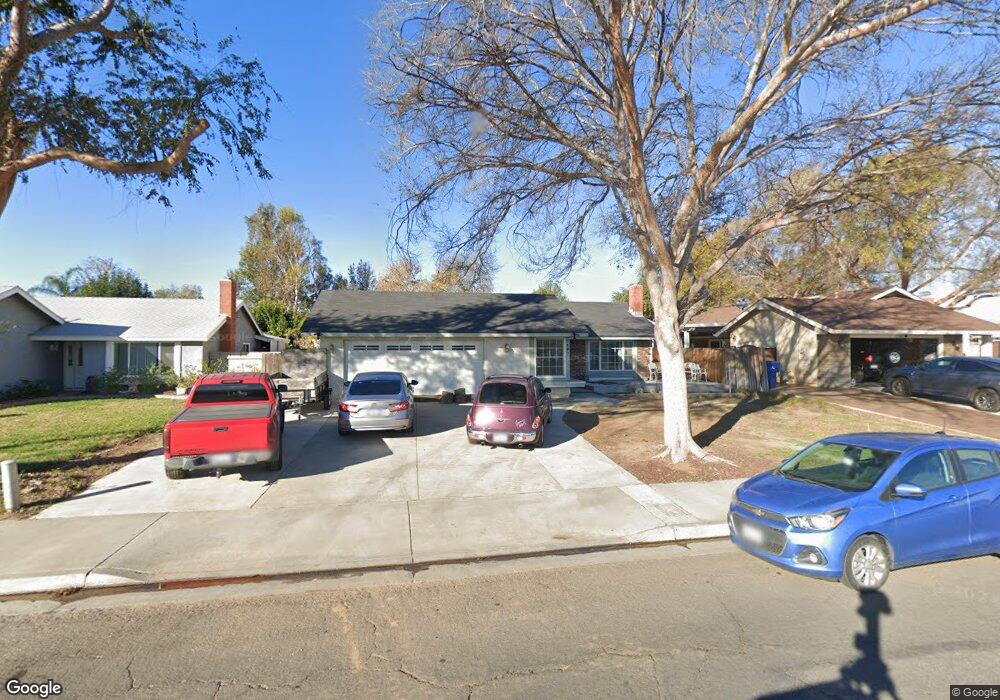
7187 Crest Ave Riverside, CA 92503
Arlanza NeighborhoodEstimated Value: $602,000 - $622,000
3
Beds
2
Baths
1,386
Sq Ft
$440/Sq Ft
Est. Value
About This Home
This home is located at 7187 Crest Ave, Riverside, CA 92503 and is currently estimated at $610,119, approximately $440 per square foot. 7187 Crest Ave is a home located in Riverside County with nearby schools including Rosemary Kennedy Elementary School, Loma Vista Middle School, and Norte Vista High School.
Ownership History
Date
Name
Owned For
Owner Type
Purchase Details
Closed on
Jul 22, 2005
Sold by
Vanhouten Alexa
Bought by
Vanhouten Marvin M and Van Houten Alexa
Current Estimated Value
Home Financials for this Owner
Home Financials are based on the most recent Mortgage that was taken out on this home.
Original Mortgage
$243,000
Outstanding Balance
$126,028
Interest Rate
5.56%
Mortgage Type
New Conventional
Estimated Equity
$484,091
Purchase Details
Closed on
Oct 30, 2002
Sold by
Vanhouten Marvin M
Bought by
Vanhouten Alexa
Home Financials for this Owner
Home Financials are based on the most recent Mortgage that was taken out on this home.
Original Mortgage
$147,200
Interest Rate
6.99%
Purchase Details
Closed on
Oct 17, 2002
Sold by
Terenti Joseph R and Terenti Lynn B
Bought by
Vanhouten Alexa
Home Financials for this Owner
Home Financials are based on the most recent Mortgage that was taken out on this home.
Original Mortgage
$147,200
Interest Rate
6.99%
Create a Home Valuation Report for This Property
The Home Valuation Report is an in-depth analysis detailing your home's value as well as a comparison with similar homes in the area
Home Values in the Area
Average Home Value in this Area
Purchase History
| Date | Buyer | Sale Price | Title Company |
|---|---|---|---|
| Vanhouten Marvin M | -- | Lsi Title Company | |
| Vanhouten Alexa | -- | Chicago Title Co | |
| Vanhouten Alexa | $184,000 | Chicago Title Co |
Source: Public Records
Mortgage History
| Date | Status | Borrower | Loan Amount |
|---|---|---|---|
| Open | Vanhouten Marvin M | $243,000 | |
| Closed | Vanhouten Alexa | $147,200 | |
| Closed | Vanhouten Alexa | $36,800 |
Source: Public Records
Tax History
| Year | Tax Paid | Tax Assessment Tax Assessment Total Assessment is a certain percentage of the fair market value that is determined by local assessors to be the total taxable value of land and additions on the property. | Land | Improvement |
|---|---|---|---|---|
| 2025 | $3,136 | $266,463 | $65,158 | $201,305 |
| 2023 | $3,136 | $256,118 | $62,629 | $193,489 |
| 2022 | $5,324 | $251,097 | $61,401 | $189,696 |
| 2021 | $5,283 | $246,175 | $60,198 | $185,977 |
| 2020 | $5,217 | $243,652 | $59,581 | $184,071 |
| 2019 | $5,179 | $238,875 | $58,413 | $180,462 |
| 2018 | $2,734 | $234,192 | $57,268 | $176,924 |
| 2017 | $2,683 | $229,601 | $56,146 | $173,455 |
| 2016 | $2,637 | $225,100 | $55,046 | $170,054 |
| 2015 | $2,597 | $221,720 | $54,220 | $167,500 |
| 2014 | $2,587 | $217,379 | $53,159 | $164,220 |
Source: Public Records
Map
Nearby Homes
- 7283 Dimaggio St
- 9780 Manitoba Place
- 10201 Oxbow Loop
- 7035 Batavia Way
- 10232 Tanforan Dr
- 9075 Cabrillo Dr
- 10060 Hillsborough Ln
- 6691 Dorinda Dr
- 8763 Sylvan Ave
- 8420 Peachwillow Ct
- 8426 Greenpoint Ave
- 8326 Greenpoint Ave
- 10115 Onyx Way
- 6331 Pedley Rd
- 10128 Camino de Rosa
- 6324 Autumn Leaf Cove
- 9206 Limonite Ave
- 8568 Pimiento St
- 8556 Pimiento St
- 8544 Pimiento St
- 7197 Crest Ave
- 7177 Crest Ave
- 10026 Hershey Way
- 10046 Hershey Way
- 10025 Chula Vista Way
- 10045 Chula Vista Way
- 10015 Chula Vista Way
- 10009 Hershey Way
- 10005 Chula Vista Way
- 10056 Hershey Way
- 10019 Hershey Way
- 10055 Chula Vista Way
- 10029 Hershey Way
- 10065 Chula Vista Way
- 10049 Hershey Way
- 10066 Hershey Way
- 10008 Julian Dr
- 10018 Julian Dr
- 10059 Hershey Way
- 10028 Julian Dr
Your Personal Tour Guide
Ask me questions while you tour the home.