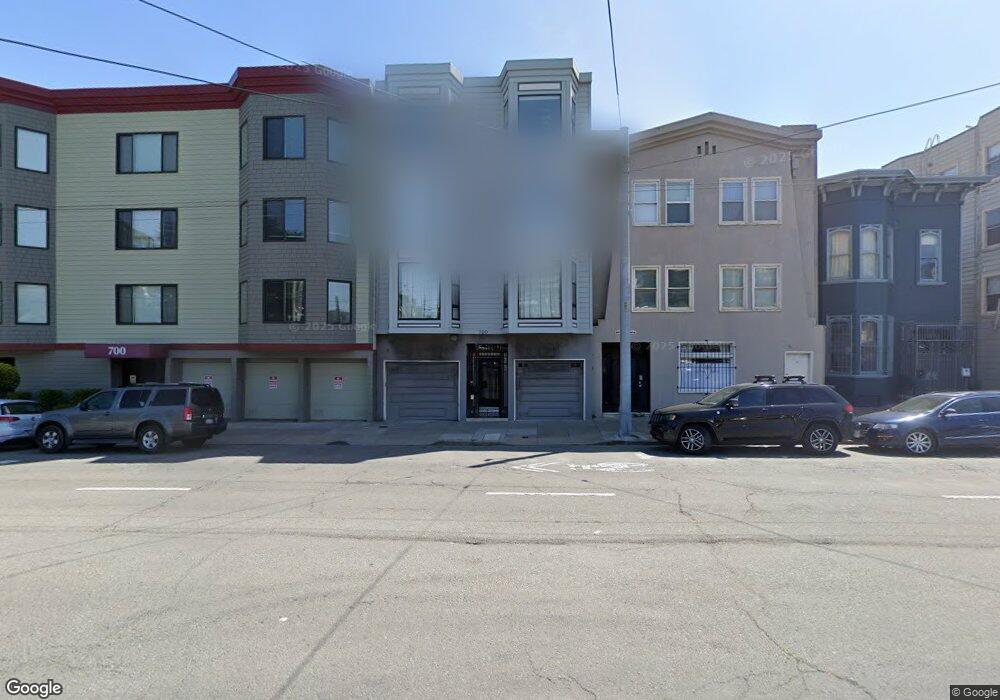
720 Presidio Ave Unit 101 San Francisco, CA 94115
Lower Pacific Heights NeighborhoodEstimated Value: $717,000 - $963,000
1
Bed
1
Bath
675
Sq Ft
$1,257/Sq Ft
Est. Value
About This Home
This home is located at 720 Presidio Ave Unit 101, San Francisco, CA 94115 and is currently estimated at $848,607, approximately $1,257 per square foot. 720 Presidio Ave Unit 101 is a home located in San Francisco County with nearby schools including Cobb (William L.) Elementary School, Roosevelt Middle School, and Presidio Hill School.
Ownership History
Date
Name
Owned For
Owner Type
Purchase Details
Closed on
Sep 19, 2014
Sold by
Tanabe Jeff Ken and Tanabe Jack T
Bought by
Tanabe Jeff Ken
Current Estimated Value
Home Financials for this Owner
Home Financials are based on the most recent Mortgage that was taken out on this home.
Original Mortgage
$130,000
Outstanding Balance
$99,265
Interest Rate
4.07%
Mortgage Type
New Conventional
Estimated Equity
$749,342
Purchase Details
Closed on
Sep 12, 1995
Sold by
Oishi Gene Sadao and Oishi Margaret Yuriko
Bought by
Tanabe Jeff Ken and Tanabe Jack T
Home Financials for this Owner
Home Financials are based on the most recent Mortgage that was taken out on this home.
Original Mortgage
$100,000
Interest Rate
7.4%
Create a Home Valuation Report for This Property
The Home Valuation Report is an in-depth analysis detailing your home's value as well as a comparison with similar homes in the area
Home Values in the Area
Average Home Value in this Area
Purchase History
| Date | Buyer | Sale Price | Title Company |
|---|---|---|---|
| Tanabe Jeff Ken | -- | Chicago Title Company | |
| Tanabe Jeff Ken | -- | Chicago Title Company | |
| Tanabe Jeff Ken | $165,000 | Old Republic Title Company |
Source: Public Records
Mortgage History
| Date | Status | Borrower | Loan Amount |
|---|---|---|---|
| Open | Tanabe Jeff Ken | $130,000 | |
| Closed | Tanabe Jeff Ken | $130,000 | |
| Closed | Tanabe Jeff Ken | $100,000 |
Source: Public Records
Tax History Compared to Growth
Tax History
| Year | Tax Paid | Tax Assessment Tax Assessment Total Assessment is a certain percentage of the fair market value that is determined by local assessors to be the total taxable value of land and additions on the property. | Land | Improvement |
|---|---|---|---|---|
| 2025 | $4,552 | $320,175 | $166,113 | $154,062 |
| 2024 | $4,552 | $313,898 | $162,856 | $151,042 |
| 2023 | $4,453 | $307,744 | $159,663 | $148,081 |
| 2022 | $4,346 | $301,712 | $156,533 | $145,179 |
| 2021 | $4,266 | $295,798 | $153,464 | $142,334 |
| 2020 | $4,353 | $292,767 | $151,891 | $140,876 |
| 2019 | $4,162 | $287,028 | $148,913 | $138,115 |
| 2018 | $4,026 | $281,402 | $145,994 | $135,408 |
| 2017 | $3,680 | $275,886 | $143,132 | $132,754 |
| 2016 | $3,596 | $270,478 | $140,326 | $130,152 |
| 2015 | $3,550 | $266,417 | $138,219 | $128,198 |
| 2014 | $3,460 | $261,200 | $135,512 | $125,688 |
Source: Public Records
Map
Nearby Homes
- 1450 Lyon St
- 3014 Pine St
- 3014 Pine St Unit A
- 2978 Pine St
- 2825 Pine St
- 3100 California St
- 22 Wood St
- 1819 Lyon St Unit 3
- 1819 Lyon St Unit 1
- 21 Wood St
- 23 Wood St
- 53 Wood St
- 48 Terra Vista Ave Unit B
- 48 Terra Vista Ave Unit A
- 2655 Bush St Unit 109
- 2655 Bush St Unit 603
- 2655 Bush St Unit 431
- 333 Presidio Ave Unit 5
- 2654-2656 Bush St
- 440 Laurel St
- 720 Presidio Ave Unit 102
- 720 Presidio Ave Unit 104
- 720 Presidio Ave Unit 301
- 726 Presidio Ave Unit 728
- 732 Presidio Ave Unit 734
- 700 Presidio Ave
- 2951 Bush St
- 2945 Bush St Unit 2947
- 2913 Bush St
- 2742 Sutter St Unit 2744
- 2911 Bush St
- 2909 Bush St
- 750 Presidio Ave
- 2736 Sutter St Unit 2740
- 2907 Bush St
- 2728 Sutter St
- 2720 Sutter St
- 2905 Bush St
- 2722 Sutter St