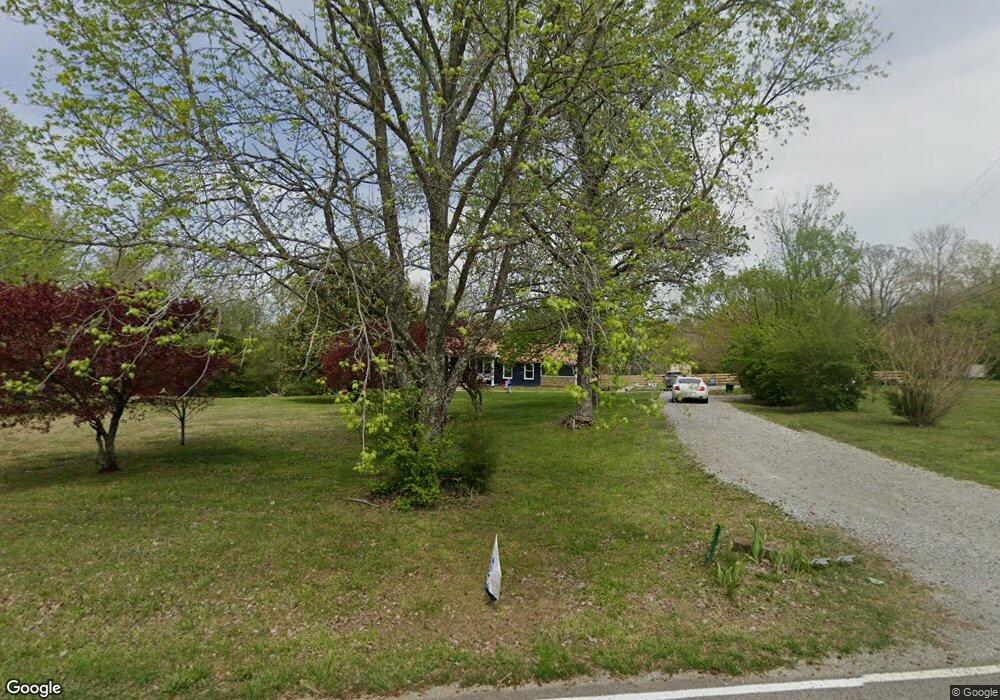
7218 Crow Cut Rd Fairview, TN 37062
Estimated Value: $469,000 - $722,000
Studio
3
Baths
1,917
Sq Ft
$290/Sq Ft
Est. Value
About This Home
This home is located at 7218 Crow Cut Rd, Fairview, TN 37062 and is currently estimated at $556,429, approximately $290 per square foot. 7218 Crow Cut Rd is a home located in Williamson County with nearby schools including Fairview Elementary School, Fairview Middle School, and Fairview High School.
Ownership History
Date
Name
Owned For
Owner Type
Purchase Details
Closed on
Jul 1, 2021
Sold by
Inman William and Cothron Leslie C
Bought by
Johnson Johnathan and Johnson Whitney
Current Estimated Value
Home Financials for this Owner
Home Financials are based on the most recent Mortgage that was taken out on this home.
Original Mortgage
$175,000
Outstanding Balance
$105,421
Interest Rate
2.26%
Estimated Equity
$451,008
Purchase Details
Closed on
Mar 29, 2012
Sold by
Inman William W
Bought by
Cropper Craig and Cropper Janet
Purchase Details
Closed on
Mar 28, 2012
Sold by
Locke Kathy L
Bought by
Inman William
Purchase Details
Closed on
Dec 22, 1997
Sold by
Inman Myrna D
Bought by
Donald William K and Donald Vicki G
Purchase Details
Closed on
Apr 18, 1997
Sold by
Daugherty C C
Bought by
Inman Myrna D
Purchase Details
Closed on
Mar 11, 1997
Sold by
Byrd Frances Gunter
Bought by
Brown Leslie Louise
Purchase Details
Closed on
Oct 14, 1994
Sold by
Loyd Talmadge
Bought by
Byrd Frances Gunter
Create a Home Valuation Report for This Property
The Home Valuation Report is an in-depth analysis detailing your home's value as well as a comparison with similar homes in the area
Home Values in the Area
Average Home Value in this Area
Purchase History
| Date | Buyer | Sale Price | Title Company |
|---|---|---|---|
| Johnson Johnathan | -- | Tennessee Title Services | |
| Cropper Craig | $30,000 | None Available | |
| Inman William | -- | None Available | |
| Inman William | -- | None Available | |
| Inman William | -- | None Available | |
| Donald William K | $22,500 | Security Escrow & Title Co | |
| Inman Myrna D | -- | -- | |
| Brown Leslie Louise | $38,973 | -- | |
| Byrd Frances Gunter | $96,500 | -- |
Source: Public Records
Mortgage History
| Date | Status | Borrower | Loan Amount |
|---|---|---|---|
| Open | Johnson Johnathan | $175,000 |
Source: Public Records
Tax History
| Year | Tax Paid | Tax Assessment Tax Assessment Total Assessment is a certain percentage of the fair market value that is determined by local assessors to be the total taxable value of land and additions on the property. | Land | Improvement |
|---|---|---|---|---|
| 2025 | $1,905 | $95,600 | $42,350 | $53,250 |
| 2024 | $1,905 | $69,100 | $21,725 | $47,375 |
| 2023 | $1,905 | $69,100 | $21,725 | $47,375 |
| 2022 | $1,905 | $69,100 | $21,725 | $47,375 |
| 2021 | $1,299 | $69,100 | $21,725 | $47,375 |
| 2020 | $1,270 | $57,200 | $14,500 | $42,700 |
| 2019 | $1,270 | $57,200 | $14,500 | $42,700 |
| 2018 | $1,230 | $57,200 | $14,500 | $42,700 |
| 2017 | $1,218 | $57,200 | $14,500 | $42,700 |
Source: Public Records
Map
Nearby Homes
- Mason Plan at Ashlyn
- Hartley Plan at Ashlyn
- Adriana Plan at Ashlyn
- Ashton Plan at Ashlyn
- Heathrow Plan at Ashlyn
- Carlton Plan at Ashlyn
- Harlow Plan at Ashlyn
- 7313 Chilton Ct
- 7316 Chilton Ct
- 7309 Chilton Ct
- 7341 Chilton Ct
- 7315 Mccormick Dr
- 7811 Bear Trace
- 7910 Pine St
- Greeley Plan at Aden Woods of Castleberry Farms
- 7904 Pine St
- Hayden Plan at Aden Woods of Castleberry Farms
- Glenwood Plan at Aden Woods of Castleberry Farms
- Yuma Plan at Aden Woods of Castleberry Farms
- Silverthorne Plan at Aden Woods of Castleberry Farms
- 7308 Crow Cut Rd
- 7214 Crow Cut Rd
- 7306 Crow Cut Rd
- 7215 Crow Cut Rd
- 7303 Crow Cut Rd
- 7219 Crow Cut Rd
- 7210 Crow Cut Rd
- 7213 Crow Cut Rd
- 7309 Crow Cut Rd
- 7208 Crow Cut Rd
- 7314 Crow Cut Rd
- 7209 Crow Cut Rd
- 7206 Crow Cut Rd
- 7301 Crow Cut Rd
- 7120 Crow Cut Rd
- 7106 Bowie Hollow Rd
- 7351 Crow Cut Rd
- 7352 Crow Cut Rd
- 7116 Crow Cut Rd
- 7353 Crow Cut Rd
Your Personal Tour Guide
Ask me questions while you tour the home.