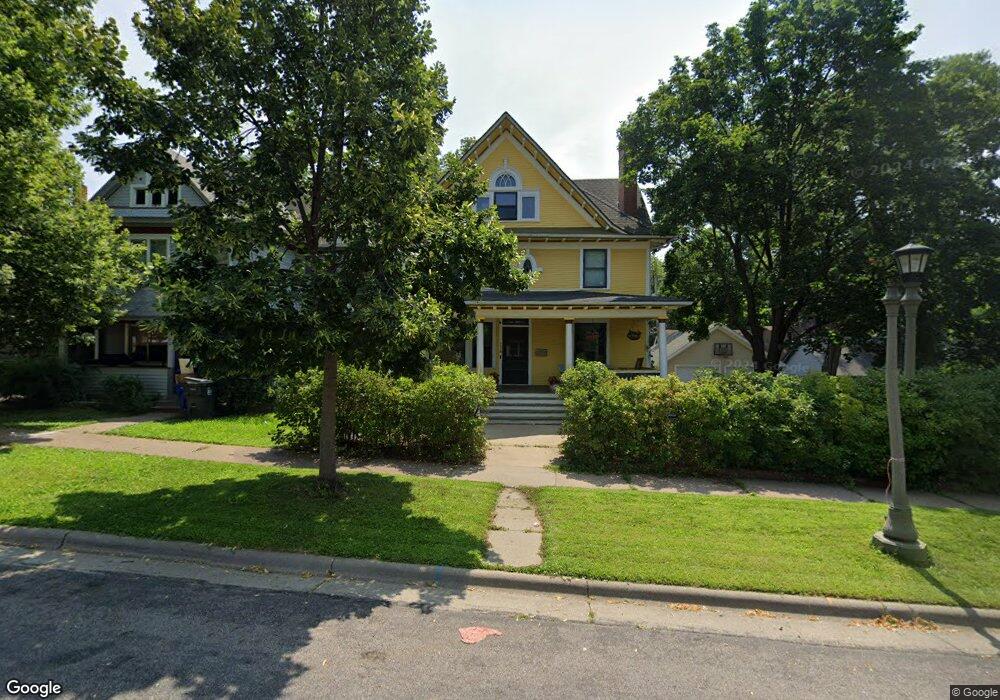
722 5th St E Saint Paul, MN 55106
Dayton's Bluff NeighborhoodEstimated Value: $381,555 - $525,000
7
Beds
3
Baths
4,019
Sq Ft
$111/Sq Ft
Est. Value
About This Home
This home is located at 722 5th St E, Saint Paul, MN 55106 and is currently estimated at $446,139, approximately $111 per square foot. 722 5th St E is a home located in Ramsey County with nearby schools including Dayton's Bluff Achievement Plus Elementary School, Battle Creek Middle School, and Harding Senior High School.
Ownership History
Date
Name
Owned For
Owner Type
Purchase Details
Closed on
Jan 15, 2004
Sold by
Smith Michael S
Bought by
Murnane Mark R
Current Estimated Value
Purchase Details
Closed on
Nov 24, 1999
Sold by
Northern Home Inc
Bought by
Smith Michael C
Purchase Details
Closed on
Aug 29, 1995
Sold by
King Alvin J
Bought by
Northern Home Inc
Create a Home Valuation Report for This Property
The Home Valuation Report is an in-depth analysis detailing your home's value as well as a comparison with similar homes in the area
Home Values in the Area
Average Home Value in this Area
Purchase History
| Date | Buyer | Sale Price | Title Company |
|---|---|---|---|
| Murnane Mark R | $225,000 | -- | |
| Smith Michael C | $72,000 | -- | |
| Northern Home Inc | $47,000 | -- |
Source: Public Records
Mortgage History
| Date | Status | Borrower | Loan Amount |
|---|---|---|---|
| Closed | Northern Home Inc | -- |
Source: Public Records
Tax History
| Year | Tax Paid | Tax Assessment Tax Assessment Total Assessment is a certain percentage of the fair market value that is determined by local assessors to be the total taxable value of land and additions on the property. | Land | Improvement |
|---|---|---|---|---|
| 2025 | $5,740 | $398,600 | $41,100 | $357,500 |
| 2023 | $5,740 | $370,200 | $21,400 | $348,800 |
| 2022 | $5,368 | $343,700 | $21,400 | $322,300 |
| 2021 | $5,104 | $325,100 | $2,100 | $323,000 |
| 2020 | $5,494 | $320,500 | $2,100 | $318,400 |
| 2019 | $5,172 | $320,600 | $21,400 | $299,200 |
| 2018 | $4,866 | $297,900 | $21,400 | $276,500 |
| 2017 | $4,636 | $292,900 | $21,400 | $271,500 |
| 2016 | $5,168 | $0 | $0 | $0 |
| 2015 | $4,730 | $291,900 | $18,100 | $273,800 |
| 2014 | $4,122 | $0 | $0 | $0 |
Source: Public Records
Map
Nearby Homes
Your Personal Tour Guide
Ask me questions while you tour the home.