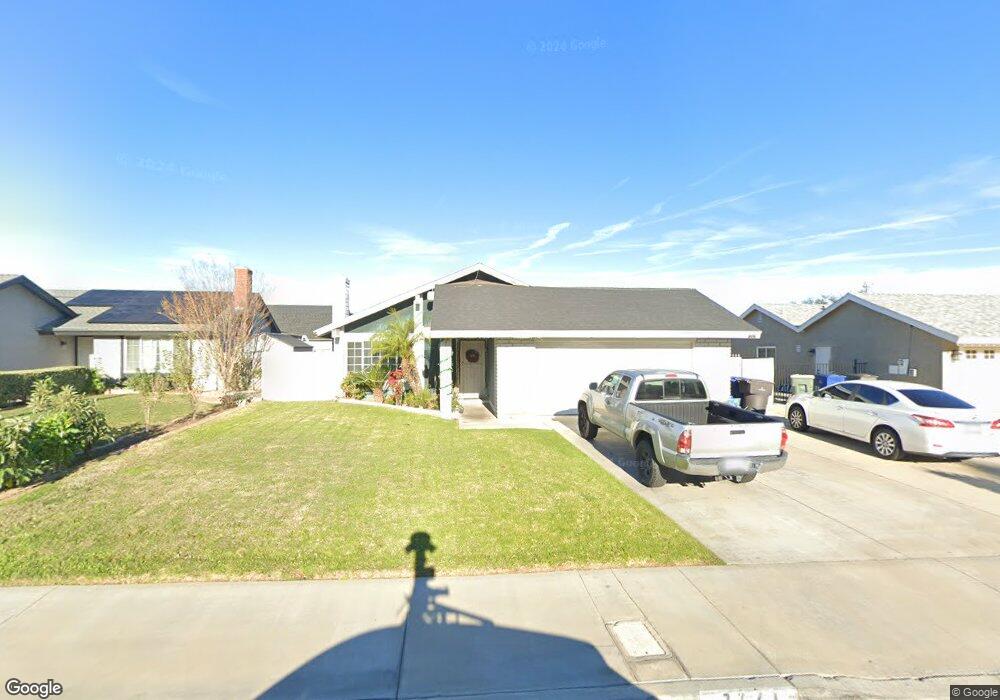
7221 Auld St Riverside, CA 92503
Arlanza NeighborhoodEstimated Value: $592,000 - $635,000
4
Beds
2
Baths
1,441
Sq Ft
$428/Sq Ft
Est. Value
About This Home
This home is located at 7221 Auld St, Riverside, CA 92503 and is currently estimated at $616,289, approximately $427 per square foot. 7221 Auld St is a home located in Riverside County with nearby schools including Rosemary Kennedy Elementary School, Loma Vista Middle School, and Norte Vista High School.
Ownership History
Date
Name
Owned For
Owner Type
Purchase Details
Closed on
Dec 27, 2012
Sold by
West John L and West Beverly J
Bought by
West John L and The Jb West Trust
Current Estimated Value
Purchase Details
Closed on
Nov 17, 2010
Sold by
Askins Hurley K and Askins Elana C
Bought by
Soto Luz Maria
Home Financials for this Owner
Home Financials are based on the most recent Mortgage that was taken out on this home.
Original Mortgage
$182,541
Interest Rate
4.75%
Mortgage Type
FHA
Purchase Details
Closed on
Dec 15, 2008
Sold by
Cox Henry C and Cox Jacqueline N
Bought by
Cox Ii Henry C and Cox Jacqueline N
Purchase Details
Closed on
Oct 25, 2007
Sold by
Askins Hurley K and Askins Elana C
Bought by
Askins Hurley K and Askins Elana C
Create a Home Valuation Report for This Property
The Home Valuation Report is an in-depth analysis detailing your home's value as well as a comparison with similar homes in the area
Home Values in the Area
Average Home Value in this Area
Purchase History
| Date | Buyer | Sale Price | Title Company |
|---|---|---|---|
| West John L | -- | None Available | |
| Cox Ii Henry C | -- | None Available | |
| Soto Luz Maria | $185,000 | Ticor Title Company Of Ca | |
| Cox Ii Henry C | -- | None Available | |
| Askins Hurley K | -- | None Available |
Source: Public Records
Mortgage History
| Date | Status | Borrower | Loan Amount |
|---|---|---|---|
| Previous Owner | Soto Luz Maria | $182,541 |
Source: Public Records
Tax History
| Year | Tax Paid | Tax Assessment Tax Assessment Total Assessment is a certain percentage of the fair market value that is determined by local assessors to be the total taxable value of land and additions on the property. | Land | Improvement |
|---|---|---|---|---|
| 2025 | $2,878 | $237,004 | $76,864 | $160,140 |
| 2023 | $2,878 | $227,802 | $73,880 | $153,922 |
| 2022 | $2,665 | $223,336 | $72,432 | $150,904 |
| 2021 | $2,630 | $218,958 | $71,012 | $147,946 |
| 2020 | $2,589 | $216,713 | $70,284 | $146,429 |
| 2019 | $2,555 | $212,464 | $68,906 | $143,558 |
| 2018 | $2,520 | $208,299 | $67,555 | $140,744 |
| 2017 | $2,474 | $204,216 | $66,231 | $137,985 |
| 2016 | $2,434 | $200,213 | $64,933 | $135,280 |
| 2015 | $2,399 | $197,207 | $63,958 | $133,249 |
| 2014 | $2,390 | $193,346 | $62,706 | $130,640 |
Source: Public Records
Map
Nearby Homes
- 10201 Oxbow Loop
- 7000 Batavia Way
- 7283 Dimaggio St
- 9731 Lasorda Ct
- 10232 Tanforan Dr
- 9669 Jurupa Ave
- 6940 Keating Dr
- 10060 Hillsborough Ln
- 9075 Cabrillo Dr
- 6691 Dorinda Dr
- 8763 Sylvan Ave
- 8420 Peachwillow Ct
- 6336 Jones Ave
- 9206 Limonite Ave
- 9240 Limonite Ave
- 8654 Greenpoint Ave
- 9451 Rancho Jurupa Dr
- 9131 Limonite Ave
- 6331 Pedley Rd
- 9401 Venetian Way
Your Personal Tour Guide
Ask me questions while you tour the home.