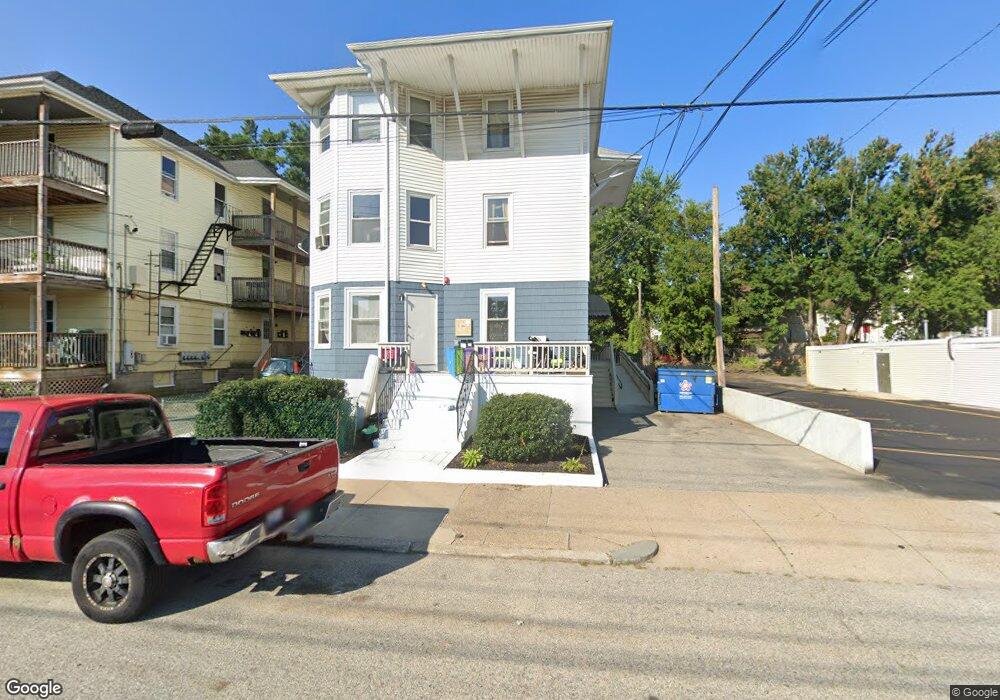
726 Front St Woonsocket, RI 02895
Globe District NeighborhoodEstimated Value: $532,540 - $685,000
8
Beds
4
Baths
4,962
Sq Ft
$123/Sq Ft
Est. Value
About This Home
This home is located at 726 Front St, Woonsocket, RI 02895 and is currently estimated at $610,885, approximately $123 per square foot. 726 Front St is a home located in Providence County with nearby schools including Woonsocket High School, Rise Prep Mayoral Academy Middle School, and Rise Prep Mayoral Academy.
Ownership History
Date
Name
Owned For
Owner Type
Purchase Details
Closed on
Dec 4, 2018
Sold by
Moreau David H
Bought by
Sfl Investments Llc
Current Estimated Value
Purchase Details
Closed on
Sep 12, 2018
Sold by
Transition House Inc
Bought by
Moreau David H
Home Financials for this Owner
Home Financials are based on the most recent Mortgage that was taken out on this home.
Original Mortgage
$239,920
Interest Rate
4.6%
Mortgage Type
New Conventional
Create a Home Valuation Report for This Property
The Home Valuation Report is an in-depth analysis detailing your home's value as well as a comparison with similar homes in the area
Home Values in the Area
Average Home Value in this Area
Purchase History
| Date | Buyer | Sale Price | Title Company |
|---|---|---|---|
| Sfl Investments Llc | -- | -- | |
| Sfl Investments Llc | -- | -- | |
| Sfl Investments Llc | -- | -- | |
| Moreau David H | $299,900 | -- | |
| Moreau David H | $299,900 | -- |
Source: Public Records
Mortgage History
| Date | Status | Borrower | Loan Amount |
|---|---|---|---|
| Previous Owner | Moreau David H | $239,920 |
Source: Public Records
Tax History
| Year | Tax Paid | Tax Assessment Tax Assessment Total Assessment is a certain percentage of the fair market value that is determined by local assessors to be the total taxable value of land and additions on the property. | Land | Improvement |
|---|---|---|---|---|
| 2025 | $7,647 | $680,900 | $87,900 | $593,000 |
| 2024 | $6,150 | $423,000 | $89,500 | $333,500 |
| 2023 | $5,914 | $423,000 | $89,500 | $333,500 |
| 2022 | $5,914 | $423,000 | $89,500 | $333,500 |
| 2021 | $5,097 | $214,600 | $35,600 | $179,000 |
| 2020 | $5,150 | $214,600 | $35,600 | $179,000 |
| 2018 | $5,168 | $214,600 | $35,600 | $179,000 |
| 2017 | $5,975 | $198,500 | $40,000 | $158,500 |
| 2016 | -- | $180,000 | $40,000 | $140,000 |
| 2015 | -- | $180,000 | $40,000 | $140,000 |
| 2014 | -- | $172,700 | $44,000 | $128,700 |
Source: Public Records
Map
Nearby Homes
- 42 Transit St
- 120 East St
- 0 Holbrook Ln Unit 1402850
- 379 Front St
- 122 Grand St
- 635 Park Ave
- 43 Summit St
- 15 Knight St
- 435 S Main St
- 190 Coe St
- 99 Allen St Unit 205
- 180 Allen St Unit 104
- 372 River St
- 184 Avenue C Unit 2
- 184 Avenue C Unit 5
- 184 Avenue C Unit 6
- 184 Avenue C Unit 3
- 184 Avenue C Unit 4
- 184 Avenue C Unit 1
- 233 Grove St
Your Personal Tour Guide
Ask me questions while you tour the home.